3 Basic concepts of economics
This module deals with the basic concepts of economics. It is intended as an introduction to the central concepts and topics of economics. We are aware that many of these terms are new to students without a background in economics. Thus, the aim of this module is not to provide you with detailed knowledge of all topics, but rather to give you an initial overview of economics. For students of economics, this chapter serves as a review and contextualization of existing knowledge.
Each basic concept is accompanied by a number of in-depth questions. These serve to allow you to test your knowledge of the respective area independently but are also intended to stimulate thought and reflection. If you have any questions about the content or would like to explore a topic in greater depth, you can contact us (see information document).
By the end of this volume you will find a link to the quiz on the basic concepts of economics. This quiz is part of the assessment and will account for 40% of your final grade. Consult the information document for more information.
Learning Outcome
Students can…
explain the basic concepts of economics.
explain the fundamentals of pluralist economics and identify different schools of thought.
3.1 Forms of provisioning in the economy
At the latest with the division of labor, questions arise for an economic system about the organization of (re)production, consumption, and distribution. This raises the following fundamental questions:
How is social surplus distributed?
Who (re)produces, maintains, and repairs what?
Who consumes what?
As the previous section has made clear, the answers depend on the perspective we take and our understanding of the economy. Here we follow Karl Polanyi, who proposes a broad understanding of the economy. Karl Polanyi distinguishes between two definitions of economy: one formal and one substantive (Polanyi (1977)). From the formalist position, economic activity is analyzed in the neoclassical sense as a purpose-rational and utility-maximizing activity in markets under conditions of scarcity. Since economic activity is reduced to market economies, essential economic sectors such as domestic and care work or public provisioning are only covered to a limited extent. Fundamental, non-market institutions of economic activity are examined, but only from the perspective of how these areas of human life can also be optimized. However, this is problematic: rationality optimizes but does not concern itself with what is being optimized, why, and for whom.
From the substantivist position, economic activity is understood as being embedded in communities and biophysical foundations. Economic activity therefore means providing the foundations of life. It does not mean optimizing to maximize utility (Nelson (1993)). Markets are not always suitable for securing the foundations of human life in all economic sectors. Economics is therefore more than market economies. The economy consists of different institutions and sectors with different logics: housing cooperatives work with different business models than plumbers and steel companies, public hospitals differ from industrial companies, and unpaid care work is organized differently than assembly line work. Karl Polanyi therefore distinguishes between four socio-economic organizational principles or forms of provisioning (what he calls forms of integration) that can be found in real economies and interact in different ways: household, reciprocity, redistribution, and market trade (Polanyi (2017)).
(1) Householding refers to forms of self-sufficiency and is rooted in families and households. In ancient Greece, the oikos, or household, was a self-sufficient economic unit. Even today, however, a large part of the economy continues to take place in the household, particularly in the form of unpaid care work, nursing, and housework (e.g., cooking, cleaning, gardening).
(2) Reciprocity is based on the principle of give and take and defines an exchange of goods and services between individuals outside the market and the state. This takes place in communities, e.g., among friends, in the neighborhood, or in associations, and includes neighborhood assistance and community work. Like the principle of householding, the form of provisioning/integration of reciprocity has its roots often in local communities and usually takes place between people who know each other.
(3) Redistribution defines a systematic flow of resources to an administrative center and their subsequent redistribution. Examples include public education, health, and pension systems financed by taxes or levies. Redistribution allocates resources to (often unknown) members of a society. It takes place within political territories, especially the nation-state, and therefore extends beyond local communities.
(4) Finally, (market) exchange defines the exchange of goods and services at market prices. This is the commodified area of economic activity. These markets can differ depending on the type of goods and services traded, their reach, and their structure. The logic of individual profit and solvency prevails in market relationships.
In summary: To this day, economic activity is shaped by a variety of institutions and principles. Real economies are always mixed economies, i.e., they are more than market economies. Not all aspects of life and economic activity are suitable for being transformed into goods that are exchanged in a market (commodified).
3.2 (Re-)production factors
Production factors are all the factors that are necessary as inputs for the production of an output, a good or a service. The aggregate production factors of an economy are described as factor endowment. The origins of production factors can be found in 18th-century physiocratic thinking, and they became established as a concept in classical economics. According to classical economics, the factors of production can be divided into three categories: land, capital, and labor. Over time, this trinity has been repeatedly criticized, expanded, and adapted. For example, entrepreneurship, knowledge & technology, and nature itself have been brought into play as additional factors. However, these aspects are often subsumed under one of the three original production factors.
In addition to neglecting other factors, this understanding is also criticized for overemphasizing the sphere of production over reproduction and maintenance, or for neglecting reproduction and maintenance and only considering them when they are sold as services (commodified). For example, a simple cup in your household is produced only once but then has to be washed a thousand times. Infrastructure and objects must be constantly repaired and maintained. And workers must also be cared and provided for, i.e., reproduced.
3.2.1 Land
The term “land” refers to natural resources used for production. These include resources such as farmland, mineral resources, and water. Companies must pay land rent (such as emission certificates or concessions for hydroelectric power plants) for the use of land, which is a scarce production factor. In some cases, natural capital is still regarded as a “pure input factor” or “only an input factor” regardless of its comprehensive life-sustaining functions, and is taken for granted. For example, a forest is reduced to its purely economically exploitable dimension, such as the sale of wood and game. It is also often neglected that nature is never available in the form of goods, but must always be made usable and economically exploitable by humans through work (Schaupp (2024)).
3.2.2 Capital
Companies acquire capital factors through investment. They do this either by using surpluses from previous production periods or by taking on loans. Capital factors include machinery, tools, buildings, and other tangible capital. Monetary capital only becomes a factor of production when it is converted into tangible capital.
3.2.3 Labor
Labor is the third factor of production and is necessary for raw materials to be turned into goods and services. Coordinating, intellectual, and executive activities are necessary for the targeted use of capital in order to be able to produce. As already mentioned at the beginning, care work is neglected here. This is especially true when this work is unpaid. In classical and neoclassical economics, the focus is strongly on paid work, while unpaid reproductive work is taken for granted.
The analysis usually only records and considers statistics on paid work. The unemployment rate is generally used as the most important indicator. This is usually calculated as follows:
\[unemployment\,rate = \frac{number\,of\,registered\,unemployed}{labour\,force} \]
However, this indicator is only one of several indicators that are used. The International Labour Organization (ILO) works with a different notion of unemployment. From this perspective, all permanent residents in Switzerland who are without work, are looking for work, and could start work within a short period of time are considered unemployed. In 2024, the unemployment rate in Switzerland averaged 2.4%, and the seasonally adjusted unemployment rate according to the ILO was 4.5% in the fourth quarter of 2024. Unlike the official unemployment rate, the unemployment rate according to the ILO also includes, for example, self-employed persons, persons affected by long-term unemployment such as those who have exhausted their unemployment benefits, and young people who are not yet in employment immediately after completing their education. Accordingly, the ILO unemployment rate is higher than the official unemployment rate. However, such indicators say nothing about the type of employment and working conditions, which means they are not useful for such assessments. More fundamental questions about the meaning and purpose of work and a high employment target cannot be discussed using such indicators.
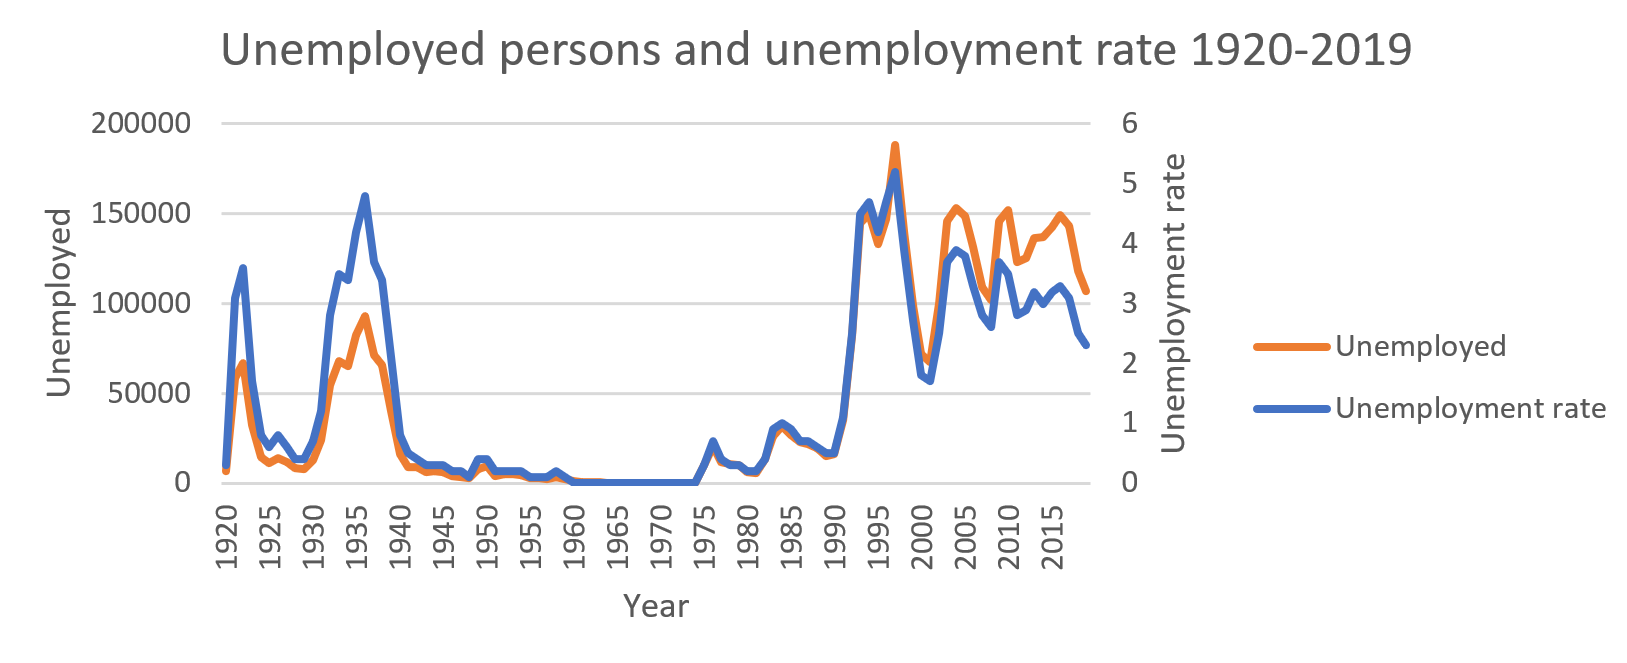
The following figure shows the development of the official unemployment rate in Switzerland since 1920. Unemployment in Switzerland has always been very low by international standards. During the post-war economic boom in particular, there was almost no unemployment in Switzerland, which is why the country attracted many workers from abroad – who often worked in precarious conditions. It was not until the crisis of the 1970s that unemployment returned to Switzerland, although the country prevented a sharp rise by exporting unemployment abroad – by 1977, almost 250,000 foreign workers had to leave the country (Degen (2012), p. 910).
Since 1997, the FSO (Federal Statistical Office) has been recording the monetary value and quantity of unpaid work in Switzerland every four years using the satellite account for household production (SHHP). In Switzerland, 9.8 billion hours of unpaid work were performed in 2020 (mostly by women), more than was spent on paid work (7.6 billion hours). The total value of unpaid work in 2020 is estimated at CHF 434 billion. If GDP is expanded to include total household production, this corresponds to 41.4% of the value added of the expanded total economy.
3.3 The marginal principle – marginal utility and marginal costs
Before we look at the form of provisioning of market exchange, we will focus on the marginal principle. This is central to the conception of the market, as it provides an explanation for the formation of value and utility and thus demand. The marginal principle has its origins in the emergence of neoclassical economics around 1870 and still forms the basis of neoclassical economics today. It deals with the question of the value of goods, thereby also influencing the allocation of goods, services, and factors of production. In contrast to classical economics, the neoclassical marginal principle departs from the objective theory of value and formulates the subjective theory of value.
The objective theory of value in classical economics postulates that all goods have an objective value. The labor invested in the production of goods was commonly used as the basis for determining this value, which gave rise to the labor theory of value. In subjective theory of value, on the other hand, no absolute values are considered, but rather the subjective values that people ascribe to goods and their marginal changes in relation to the initial situation. This focus on marginal changes forms the basis of the marginal principle. The marginal principle enabled differential calculus to be applied to cost/benefit and revenue functions, which led to the sustained rise of mathematical models in economics.
3.3.1 Revenue function of land and marginal revenue
The marginal principle was originally observed in the revenue function of land. Studies of agriculture in the 18th century revealed the relationship between factor input and revenue (originally yield in agricultural production). Marginal revenue is the increase in yield resulting from an additional unit of a production factor.
“It is in the nature of agriculture – and this is a very noteworthy circumstance – that the increase in production does not rise in direct proportion to the number of workers employed, but that each worker employed later produces less than the previous one.” - Johann Heinrich von Thünen, Der isolirte Staat, 1850. Quoted in Winfried Reiss, Mikroökonomische Theorie: Historisch fundierte Einführung, 2007,p.90, own translation
What von Thünen observed with the factor of labor was also noted by A.R.J. Turgot with the use of the factor of capital in the form of fertilizer. The principle of marginal productivity can also be applied to industrial production and, for example, to the number of workers in a factory.
3.3.2 Gossen’s laws
In 1854, Hermann Heinrich Gossen developed his laws of human interatctions and the rules for human behavior that follow from them. In them, he formulated the regularity of individual preferences and their satisfaction, which is based on the respective utility.
3.3.2.1 Gossen’s first law: the Law of Diminishing Marginal Utility
The law of diminishing marginal utility, also known as the law of diminishing marginal utility, states:
“The magnitude of one and the same pleasure diminishes continuously as we continue to enjoy it, until finally saturation is reached.”
Hermann Heinrich Gossen, Entwickelung der Gesetze des menschlichen Verkehrs, und der daraus fliessenden Regeln für menschliches Handeln, Braunschweig 1854,p.4, own translation.
Thus, the utility of the first cup of coffee in the morning is greater than that of the third or fourth. The same applies to living space, where, for example, the first bathroom in an apartment is of greater utili-ty to the residents than the second. According to the theory, this law can be applied to all goods.
3.3.2.2 Gossen’s second law: the Law of Equi-marginal Utility
The law of equal marginal utility, also known as the law of equi-mariginal utility, states:
“A person who is free to choose between several pleasures but does not have enough time to enjoy them all to the fullest, must, however different the absolute magnitude of the individual pleasures may be, in order to maximize the sum of his pleasure, before he fully prepares even the greatest of them, prepare them all partially, and in such a proportion that the magnitude of each pleasure remains the same for all at the moment when its preparation is interrupted.”
Hermann Heinrich Gossen in Entwicklung der Gesetze des menschlichen Verkehrs, und der daraus fliessenden Regeln für menschliches Handeln 1854, p.12, own translation
This law aims at the optimal use of limited resources for various goods. The optimal utility for an individual is achieved when the marginal utility (i.e., the utility of the next additional unit) is the same for all goods. Mathematically, this means that the marginal utility functions of the various goods are equated. The marginal utility corresponds to the maximum price that the person in question is willing to pay. The aggregate demand (function) can be determined by aggregating the marginal utility (functions) of all individuals. The marginal principle thus forms the core of neoclassical consumption theory. For interested students (who are familiar with the basics of neoclassical economics), we recommend a critical discussion of neoclassical consumption theory by Ben Fine.
Marginal costs and marginal revenue in companies As derived above, marginal revenue describes the revenue from an additional unit. Similarly, the term marginal cost describes the cost of an additional unit. Marginal costs can be determined by deriving the mathematical cost function. The costs [C] of a company are the sum of the fixed costs [Cf] (e.g., rent, machinery) and the variable costs [Cv] (labor, raw materials, intermediate products).
\[ C = C_f+C_V \]
According to neoclassical theory, companies are guided not only by the cost function but also by the revenue function. This describes how much revenue [R] is generated from the sale of a good depend-ing on quantity [Q] and price [P]. Deriving the revenue function yields the marginal revenue, which is the revenue from an additional unit sold.
\[ R = Q * P \]
A company produces until the marginal costs exceed the marginal revenues. This can be calculated by equating the derivatives of the cost and revenue functions. In market equilibrium (under perfect com-petition), theoretically the price corresponds to the marginal costs. Although neoclassical theory focuses heavily on the price, it has paid little attention to how companies set prices. In his dissertation, Nubbemeyer (2010) shows that until the middle of the 20th century, there was a controversial debate about whether companies actually base their pricing on the marginal principle or on alternative concepts (e.g., mark-up pricing as in some post-Keynesian models). Although the debate was not conclusively resolved, the marginal principle prevailed with the advent of neoclassical economics.
3.4 How the market works
As described above, in neoclassical economics, i.e., mainstream economics, the market is regarded as the central institution for the provision of goods and services. We will therefore take a closer look at how the market is conceptualized in neoclassical economics.
3.4.1 The market as a central coordinating authority
In markets, supply and demand meet and serve as the basis for the price mechanism. Supply is the willingness of an actor to offer goods, services, or factors, and demand is the willingness to purchase them. The utility functions of the actors, which can be calculated on the basis of the marginal principle, form the basis for demand. Aggregate demand is the sum of the individual utility functions.
In economics, markets are usually represented by price-quantity diagrams. The axes represent quantity and price (or wages in labor markets and interest rates in capital markets), while supply and demand are represented by curves. The slope of the curves changes with the elasticity of supply and demand and shows how strongly they change when quantity or price changes.
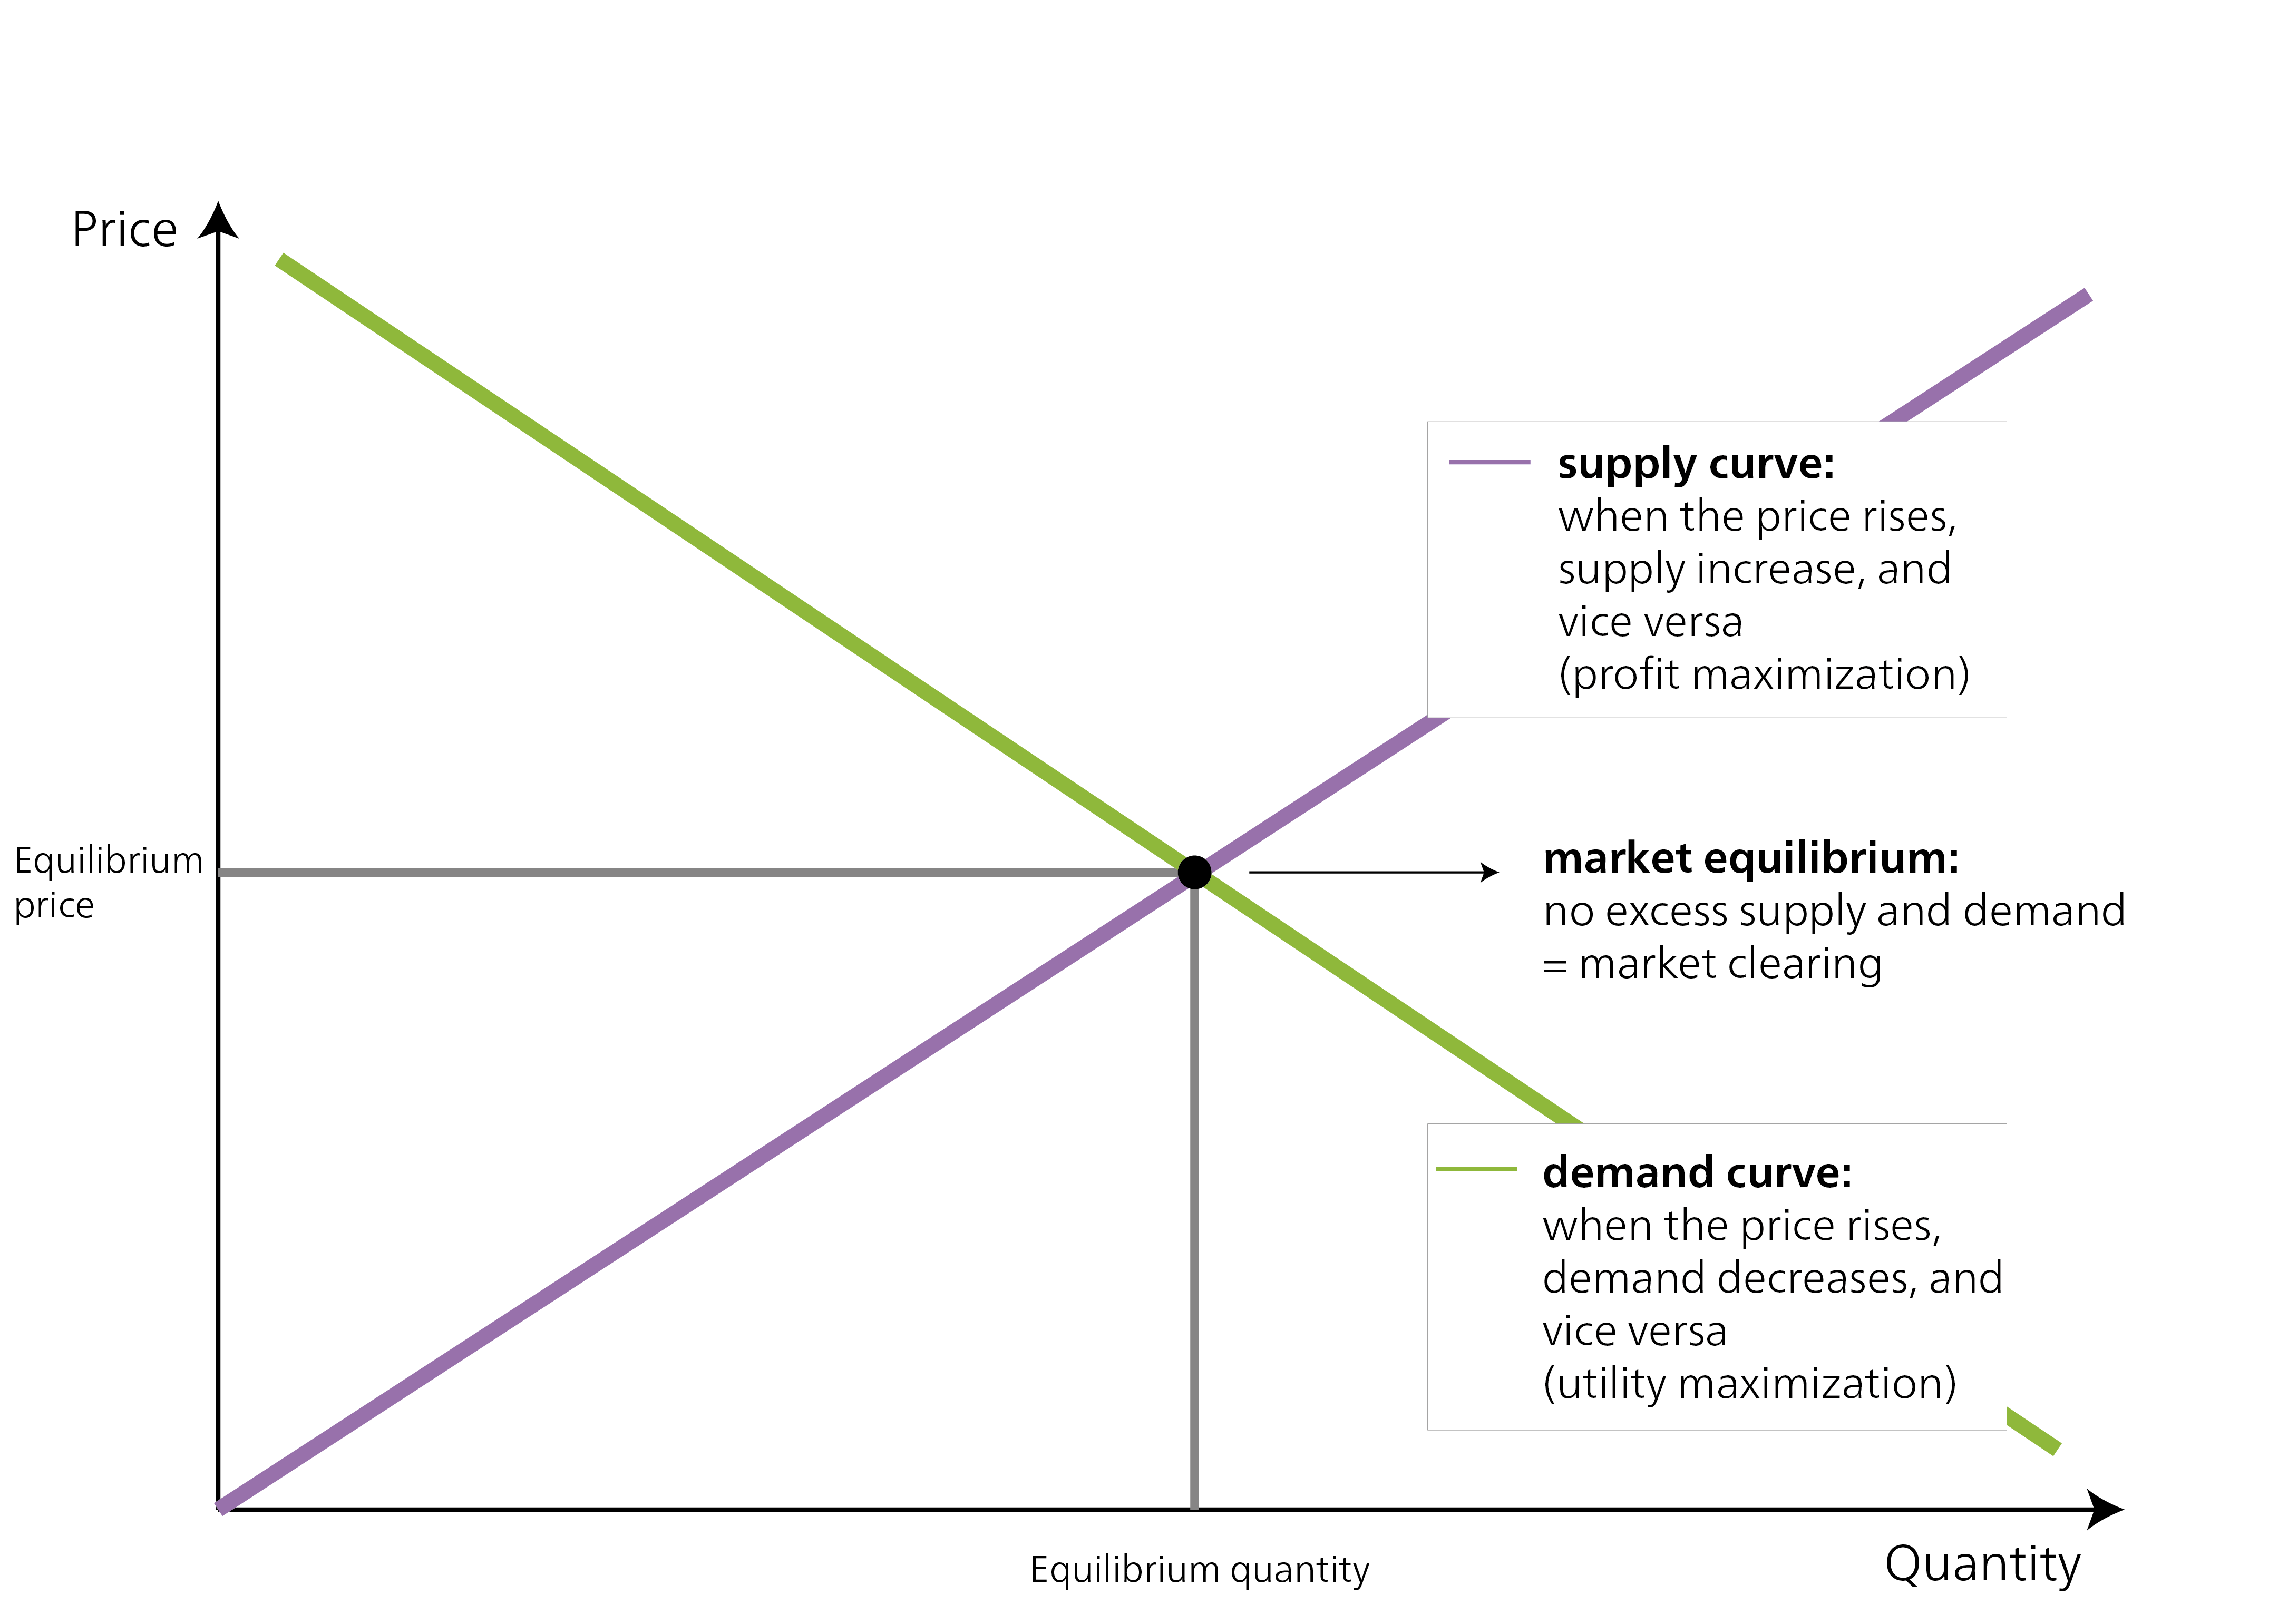
If the supply of a good is too high, the price falls; if demand is too high, the price rises. In market equilibrium, demand equals supply and the price stabilizes. The price mechanism thus determines who produces what, how much is produced, and for whom. The price is therefore regarded as the central allocation instrument in markets. For example, a factory that produces with outdated machinery cannot produce at the same price as another factory with more modern equipment. Due to the high production costs, it is forced out of the market and must produce other goods or file for bankruptcy. A central assumption for the supply curve to have an upward slope is that above a certain size the marginal costs of companies rise again (even in the long term), for example due to increased coordination costs, meaning that there is a limit to growth for companies. However, this assumption is controversial (see, for example, Keen (2010), Pirgmaier (2017)). If this assumption is not fulfilled, the supply curve could also have a different slope and there would be no guaranteed market equilibrium with many competitive companies, but rather a tendency toward monopoly. Even Alfred Marshall, the founder of this price-quantity diagram, repeatedly struggled with the question of whether there could also be a tendency toward monopoly (Marshall (1919), p. 316; Marshall (1919), p. 324).
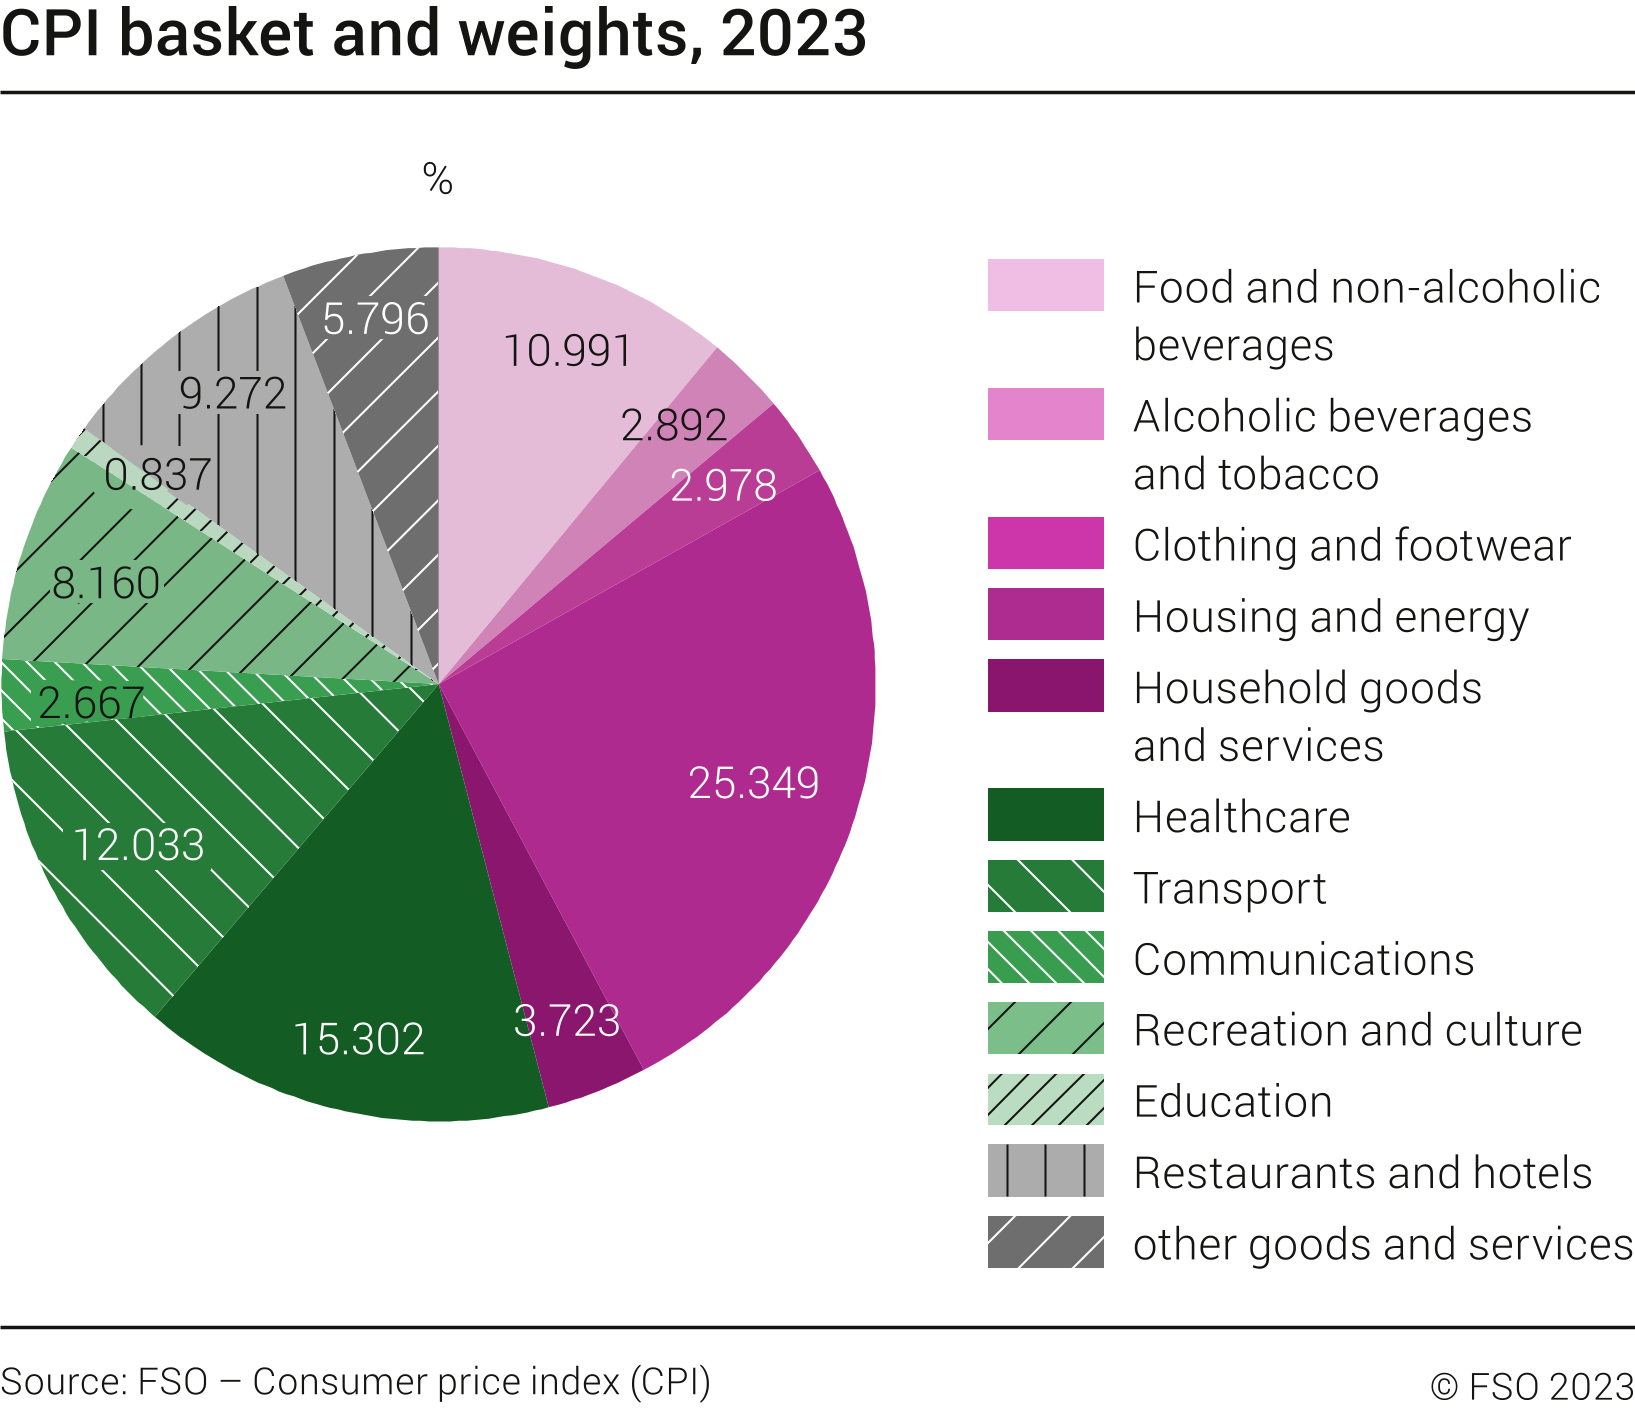
Given the importance of the price mechanism for the functioning of markets, the price level in an economy is one of the most important variables to be observed and analyzed. Price stability is measured by the inflation rate (rate of price increases) of goods and services. Low inflation of up to 2% is considered a stable price level. Statistical offices use a standardized “basket of goods” to record how the price index of the cost of living changes over time. If the price level falls, this is referred to as deflation. The composition of the basket of goods varies from country to country and usually covers only markets for goods, but not capital markets.
In Switzerland, the Federal Statistical Office (FSO) compiles the National Consumer Price Index (CPI). The figure below shows the consumer goods that make up this index and their respective shares. The basket of goods contains “the most important goods and services consumed by private households.” The weighting is based on annual household surveys and is intended to reflect actual consumption patterns as accurately as possible.
3.4.1.1 The invisible hand of the market
The term “invisible hand” is often used to describe the self-regulation of markets. The term was coined by Adam Smith. Adam Smith used the term twice in his earlier work “The Theory of Moral Sentiments” (1759) and once in his work “The Wealth of Nations” (1776). In “The Wealth of Nations,” Smith uses the term in the chapter on “Of Restraints upon the Importation from Foreign Countries of such Goods as can be Produced at Home”. In this context, Smith writes that if someone prefers to support the national economy instead of the foreign economy, that person is guided by an invisible hand. Noam Chomsky therefore interprets Smith as describing a “home bias” in this passage. However, various economists have interpreted the passage differently. The most popular interpretation sees this passage as establishing the self-regulating forces of the market. Market forces are a regulating force that leads individuals to satisfy their individual needs in the best possible way, which at the same time serves society by distributing goods in the best possible way. Such an interpretation is controversial in view of the surrounding context and is repeatedly criticized by experts in the history of economic thought.
“As every individual, therefore, endeavours as much as he can both to employ his capital in the support of domestic industry, and so to direct that industry that its produce may be of the greatest value; every individual necessarily labours to render the annual revenue of the society as great as he can. He gener-ally, indeed, neither intends to promote the public interest, nor knows how much he is promoting it. and he is in this, as in many other cases, led by an invisible hand to promote an end which was no part of his intention. Nor is it always the worse for the society that it was no part of it. By pursuing his own interest he frequently promotes that of the society more effectually than when he really intends to promote it. I have never known much good done by those who affected to trade for the public good.”
Smith, Adam. An Inquiry into the Nature and Causes of the Wealth of Nations. Edited by Edwin Cannan. Chicago: University of Chicago Press, 1976.
3.4.1.2 Perfect competition
A basic prerequisite for the functioning of markets is that of perfect competition. In perfect competition, individual suppliers have no influence on the price, because if the price increases, consumers will buy from other suppliers. Companies must accept the market price as a given and can only decide on the quantity they offer. They are therefore in the role of price takers and quantity adjusters.
For a market to be considered perfectly competitive, several conditions must be met:
Large mumber of Market participants: There must be many suppliers and consumers. This structure is referred to as a polypoly (in German “Polypol”, however, in English usually just referred to as perfect competition). In contrast, a market with only a few suppliers or consumers is called an oligopoly (few suppliers) or oligopsony (few consumers). If there is only one supplier or consumer, the market is a monopoly or monopsony, respectively (see diagram below for an overview).
Perfect information: All participants must have full and equal access to relevant information. There should be no hidden agreements between market actors or undisclosed quality deficiencies in the goods offered.
No consumer preferences for specific suppliers: Consumers must be indifferent to which supplier they buy from. A perfectly competitive market requires that buyers can switch freely between suppliers. If consumers favor a specific supplier, that supplier could charge a price above the market rate without losing demand, which violates the condition of perfect competition.
If the above conditions are not met, there is a distortion of competition. In a neoclassical market economy, the state should intervene with regulations in such a situation.
| one buyer | few buyers | many buyers | |
|---|---|---|---|
| One seller/supplier | Bilateral Monopoly | Limited Supply Monopoly | Monopoly |
| Few sellers/suppliers | Restricted Monopsony | Bilateral Oligopoly | Oligopoly |
| Many sellers/suppliers | Monopsony | Oligopsony | Polypoly |
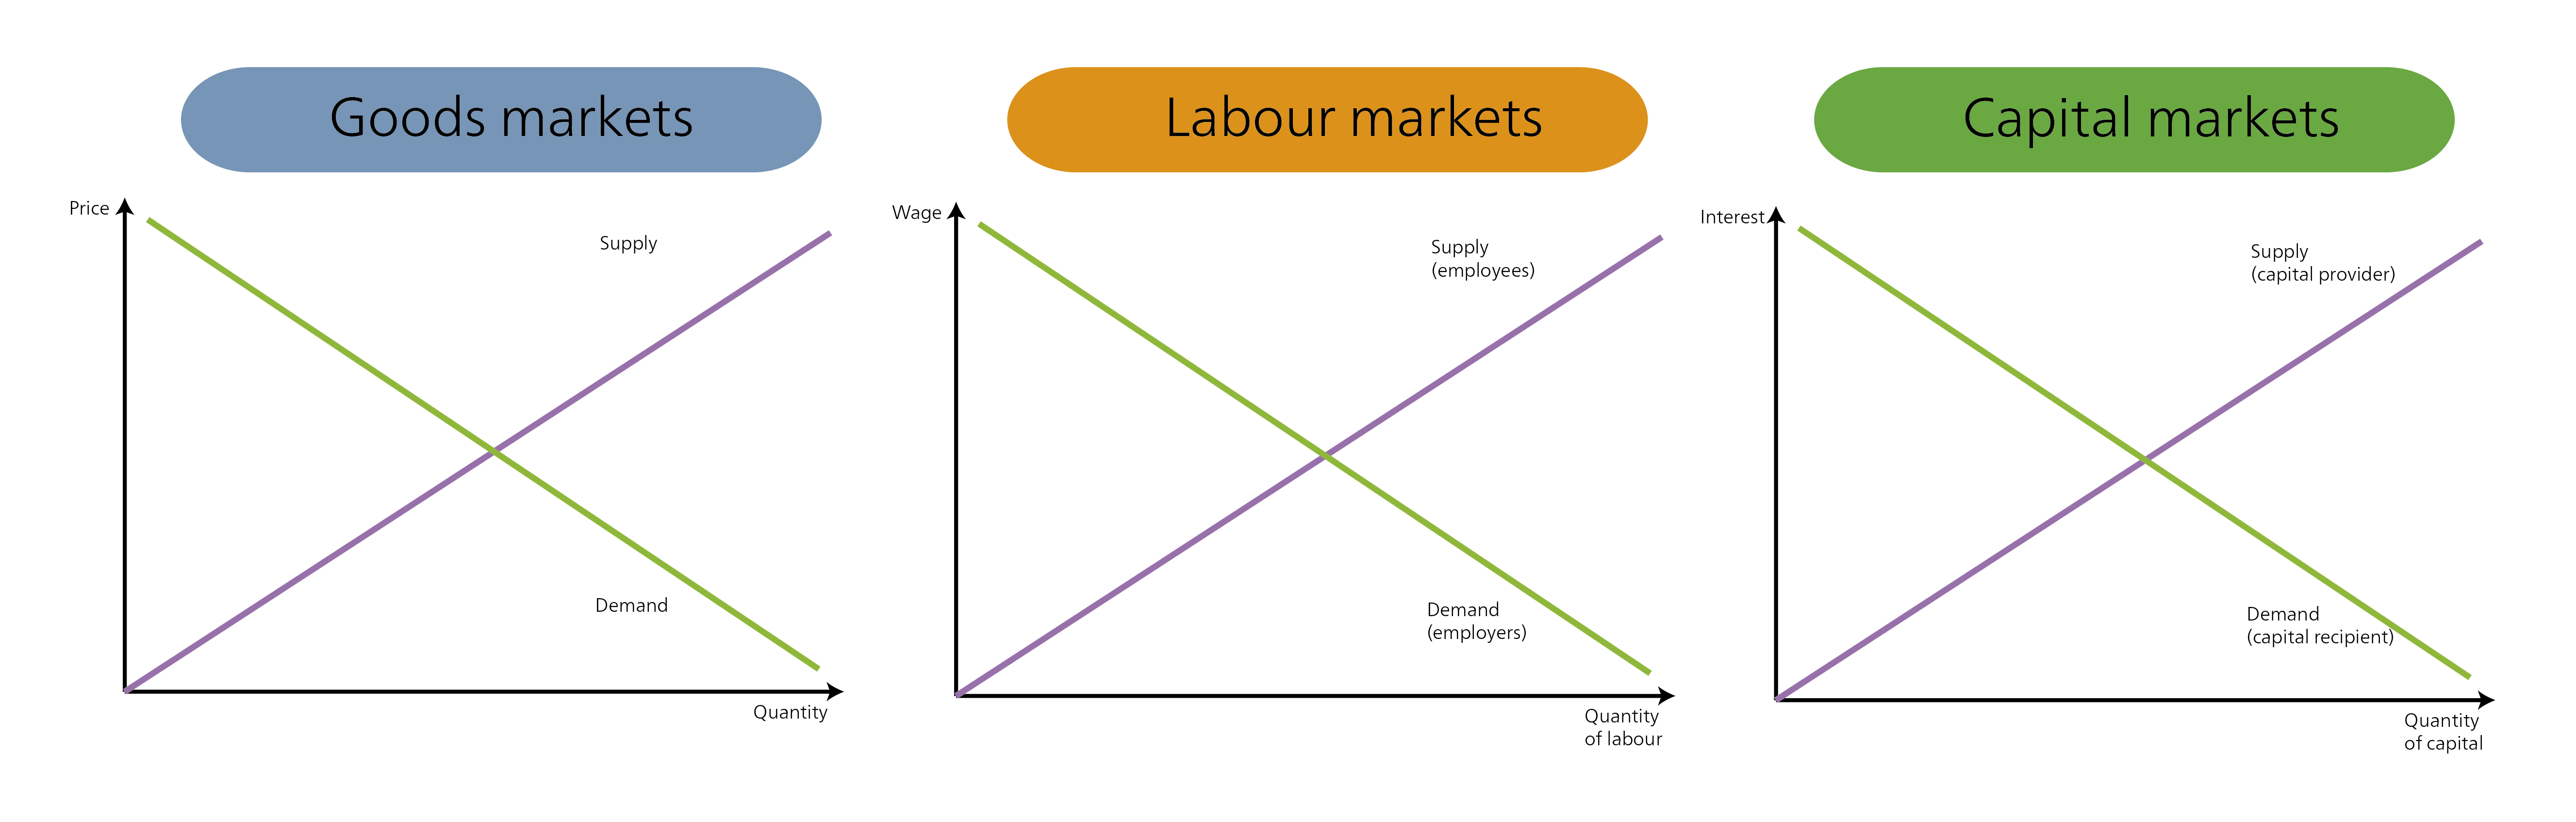
This market mechanism for coordinating supply and demand is applied to various markets. A fundamental distinction is made between goods markets and factor markets. Goods and services are traded on goods markets. On factor markets, the factors of production (land, capital, labor) are supplied and demanded. For example, households offer their labor on the labor market, and instead of a price, the demand from companies determines the level of wages paid through the price mechanism. Karl Polanyi describes how the introduction of factor markets led to the development of today’s “market society” and how social processes are increasingly aligning themselves with market logic (Polanyi (2017)).
3.5 Economic actors
Economic activity is shaped by various actors. They all have different roles, interests, and possibilities for action. Such actors include companies, households, the state, civil society, financial institutions, etc. Different degrees of complexity or perspectives mean that more or fewer of these actors are included in the analysis. And depending on how the economy is conceptualized, the roles of the actors and how they interact with each other also change. The circular flow analysis is the most common concept of economic activity, but there are many different variants.
3.5.1 Circular flow analysis
In the circular flow analysis, which dates back to François Quesnay (1694-1774), economic activities are recorded as flows of goods and money between different actors and represented graphically. The main actors are households and companies, and in more complex representations, the state, banks, and foreign countries are also included. The graphical representation of economic processes serves to simplify the modeling of theoretical assumptions.
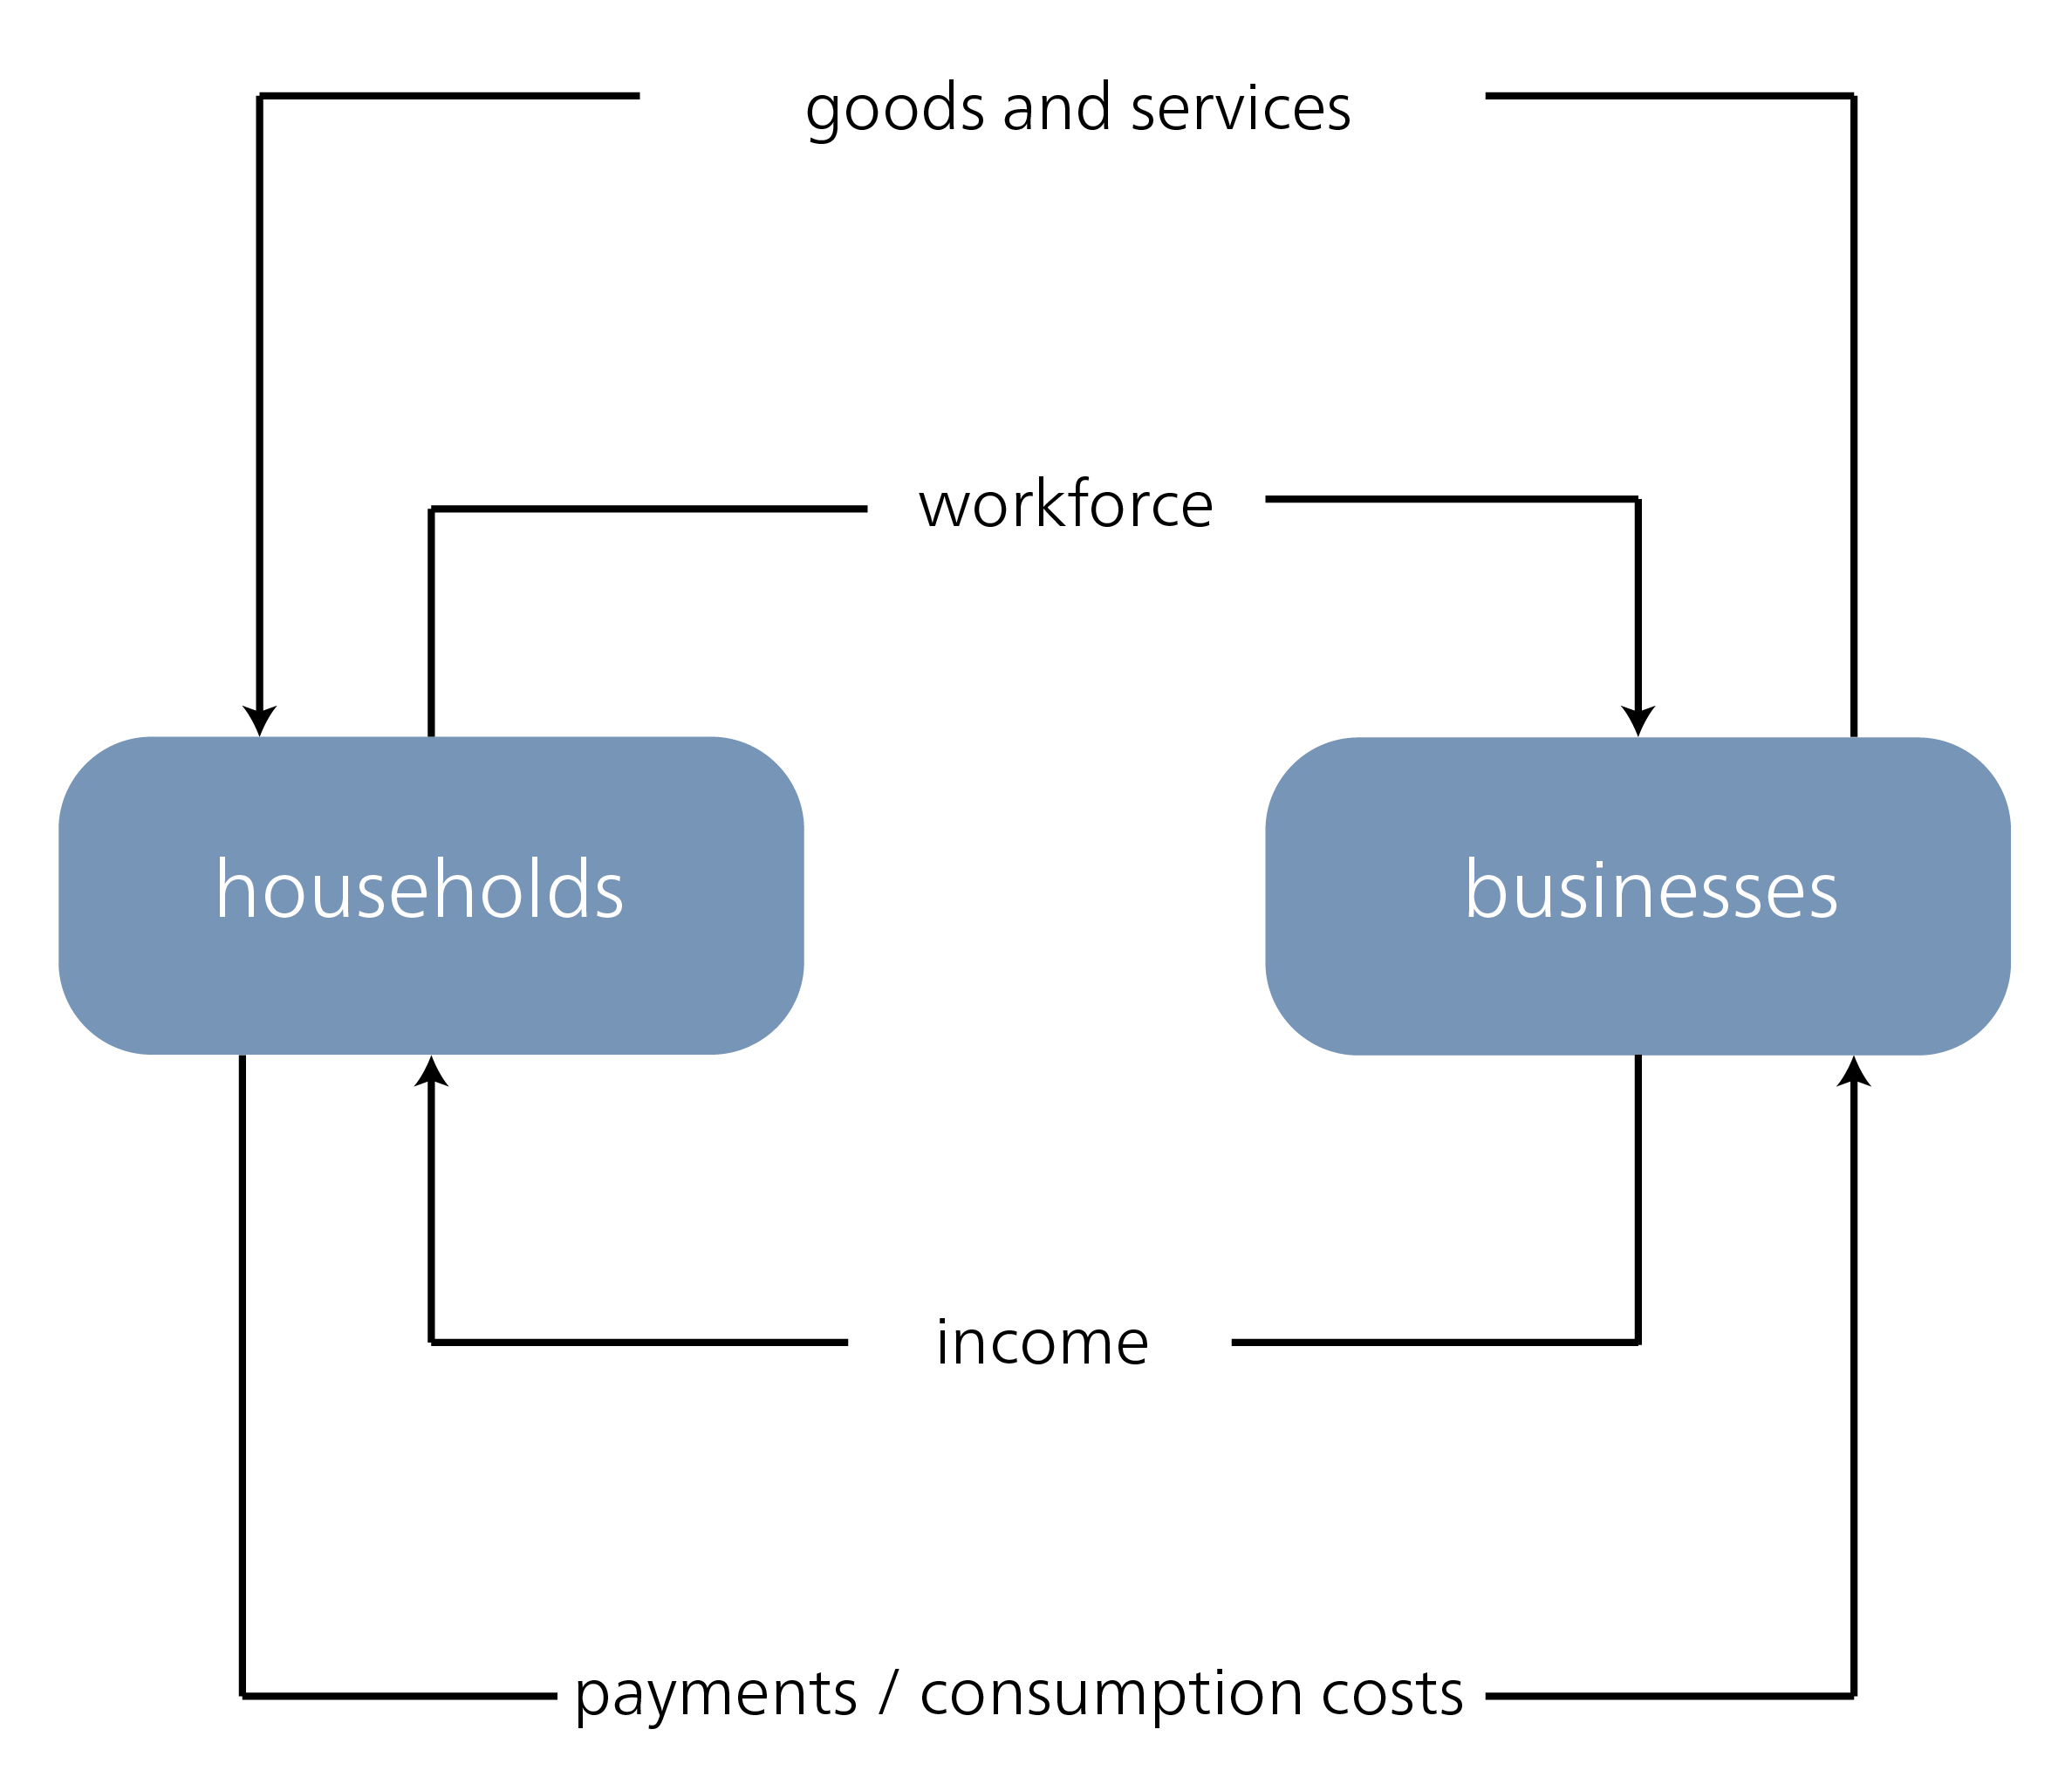
In a simple circular flow of the economy, households and companies are linked. The former provide the latter with their labor in exchange for wages. Using labor and other factors of production, companies produce goods and services that households consume.
In a circular flow of the economy, expenditure always equals income at an aggregate level. Households receive wages (W) and can consume these again as expenditure (C). Companies receive profits (P) and spend these again in the form of investment (I).
\[ Revenue = Expenditure \] \[ W+P = C+I \]
 This simple circular flow can be extended to illustrate more complex relationships by adding other actors.
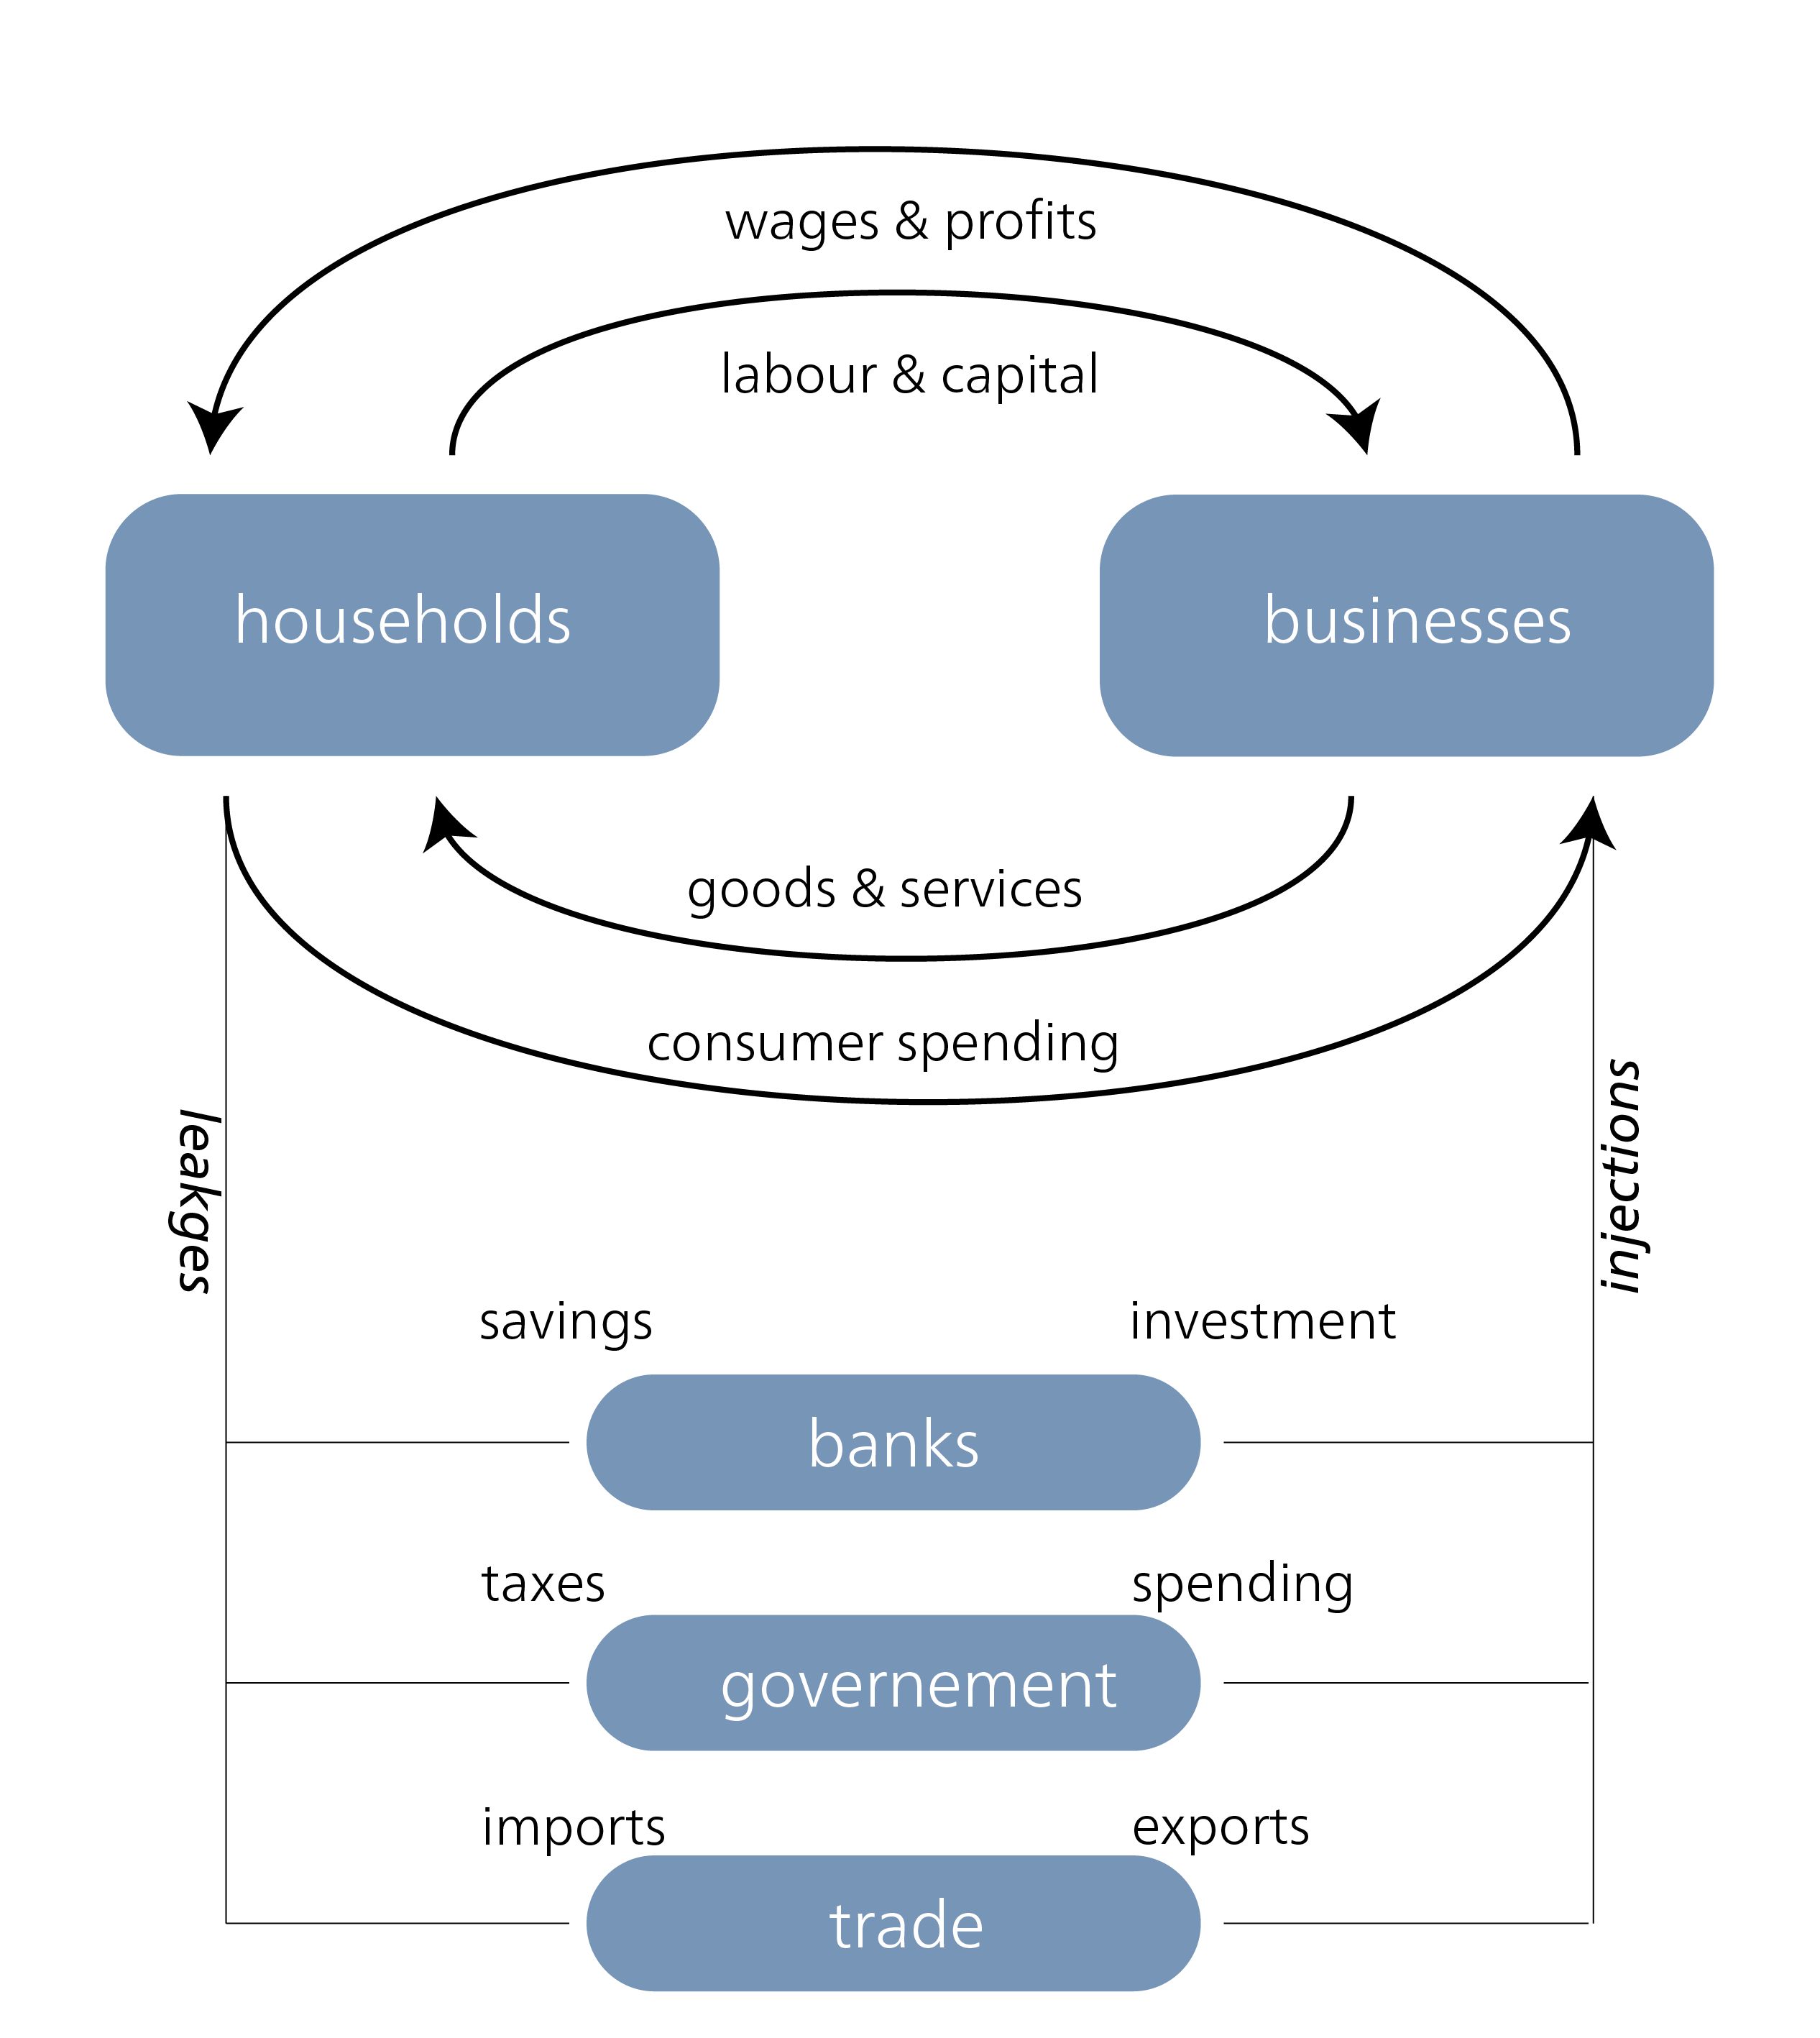 By describing economic relationships, circular flow analysis makes it possible to explain and predict phenomena. It also provides a basis for economic policy measures based on systematic investigations of economic relationships, connections, and regularities.
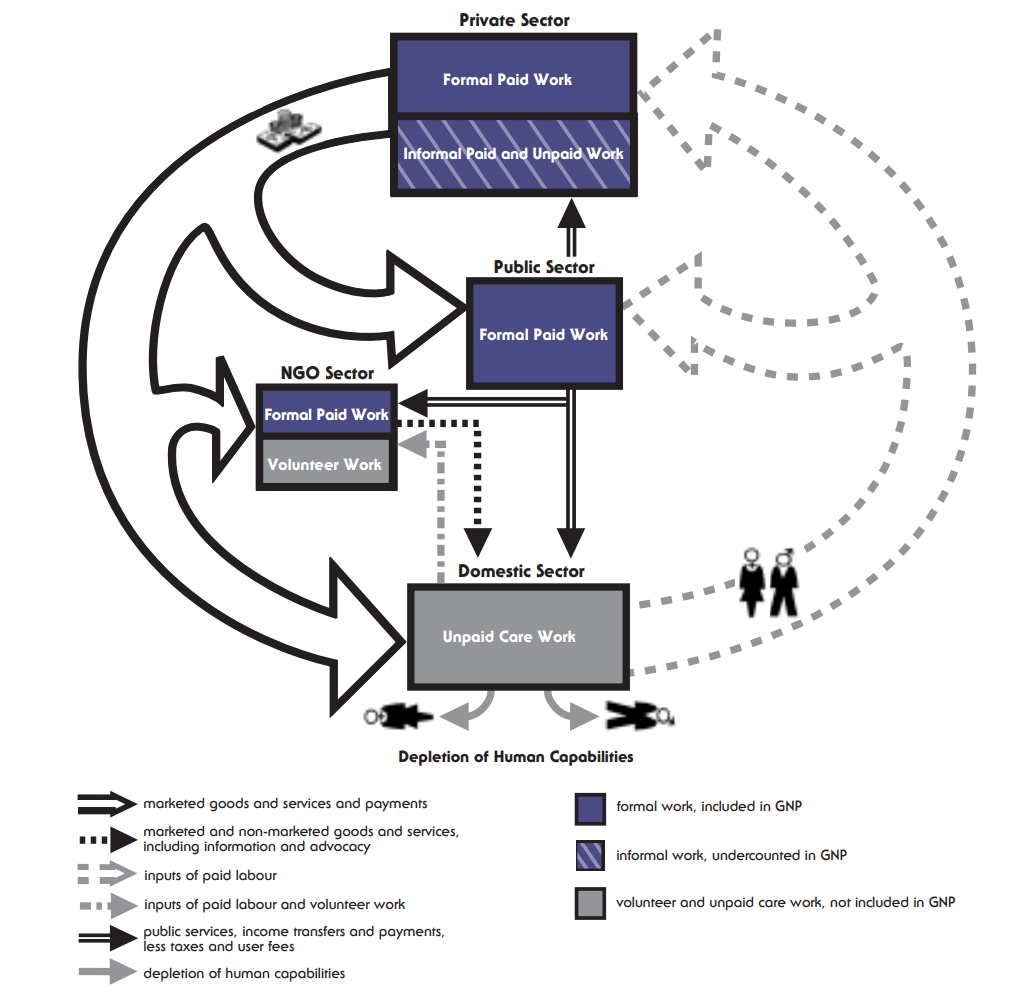
In most conventional circular flow analyses, only the market economy is represented as a producing and value-creating entity. Households are merely portrayed as consumers. Unpaid work and (re)production that take place outside the sphere of the market economy are thus systematically neglected and devalued. Feminist economics has formulated this criticism and has dealt extensively with alternative concepts. Diane Elson’s circular flow model serves as an illustration here. If you are interested, you can explore the perspective of feminist economics in more depth in section 4 on pluralist economics.
3.6 Division of labor
Alongside the invisible hand, Adam Smith’s needle factory is probably the best-known excerpt from his work. The first chapter deals with the division of labor in a needle factory and how this greatly increases productivity. Based on this, Adam Smith makes a more general observation about how the division of labor increases productivity. Individuals, companies, or countries that specialize in a particular activity can perform it increasingly better. This gives them an absolute advantage in production over others. Economic entities increasingly specialize in those areas in which they are better than others. If an entity is not superior to another in any area, it cannot participate in activities around market exchange.
David Ricardo later criticizes Smith’s theory of absolute advantages. According to Smith, if one economic entity were superior to another in all respects, it would produce everything itself. Ricardo, on the other hand, established the theory of comparative advantage. This states that entities produce those goods in which they have the greatest relative advantage or the least relative disadvantage compared to others. In this case, it still makes sense for entities that are not superior to others in any activity to participate in a common economy. In doing so, they take on tasks for which others are better qualified but do not prioritize due to a lack of resources.
Example: Ricardo illustrated his theory using the example of trade (cloth and wine) between England and Portugal, aiming to show that free trade would be beneficial for both sides. It was a plea against the import restrictions and tariffs between countries that were prevalent at the time and based on mercantilist logic. This short video illustrates the basic idea behind Ricardo’s theory of comparative cost advantages:
Ricardo is often cited to illustrate that free trade is beneficial for all countries involved. Although widespread, this perspective should be viewed critically. For one thing, the term “free trade” quickly loses its meaning in the context of European imperialism, which was emerging at the time Ricardo developed his theory. During this period, the global market was shaped by the prevailing power relations, primarily to the advantage of the Global North. It was based on the exploitation of the Global South and created unequal structures, some of which persist to this day (see, for example, Anievas and Nişancioğlu (2015), Davis (2017), Ghosh (2021), Hickel (2017)). In addition, advantageous participation in global trade requires a country to have competitive industries. Western Europe and the US also built up their industries under the protection from the global market and with industrial policies (Chang (2002)). The forced economic opening of many countries in the Global South from the end of the 1970s onwards by institutions such as the International Monetary Fund made it difficult for them to develop their own competitive manufacturing industries and pushed them back into the production or extraction of raw materials (see, for example, Palma (2003)). Dorninger et al. (2021) show how strongly this unequal exchange manifests and materializes in various aspects (e.g., land use, resource consumption, etc.).
3.6.1 Types of division of labor
From an economic perspective, division of labor can be divided into three main types: intra-company division of labor, inter-company division of labor, and international division of labor.
Intra-company division of labor describes the division of tasks within a company that was prevalent in the course of industrialization. Mass production in factories replaced serial production in manufactories. According to Taylorist (after Frederick W. Taylor, 1856-1915) and Fordist (after Henry Ford) principles, work was divided into small, repetitive steps. Workers were no longer responsible for manufacturing an entire product, but only for a small step along the assembly line.
In the inter-company division of labor, production processes are distributed across economic actors. An example of this is the spread of supplier companies, which can produce intermediate products (e.g., semiconductors) more cheaply for other companies due to their specialization.
Finally, the international division of labor describes the division of labor at the global level. With the increase in globalization since the 1980s, the interdependence of the global economy has steadily grown. In addition, the division of labor is increasingly taking place along the value chains of individual goods and not just between goods. A separate field of research has developed on such global value chains.
3.7 Categories of goods
Goods are all things and services that have been made usable from nature or produced by humans to satisfy needs. Their various characteristics and the social structures surrounding them significantly influence how different actors interact with them and how their use is regulated.
3.7.1 Good characteristics
We categorize goods depending on whether or not people can be prevented from consuming them (excludability) and whether or not they can consume them without affecting their availability to other individuals (rivalry).
All goods can be divided into one of four types based on these two characteristics of rivalry and exclusivity.
| Characteristics | rival in use | non-rival in use |
|---|---|---|
| excludable use | Private goods bread apartment clothing |
Club goods cable television streaming services national park |
| non-excludable use | Common goods high seas fishing grounds Gotthard road tunnel on the Easter weekend |
Public goods legal system waterway corrections fireworks |
Private goods are both excludable and rival in consumption. This means that it is possible to prevent people from consuming them through measures and that the consumption of a good cannot be repeated by any number of people. Because of these characteristics, private goods are characterized as good for market exchanges.
Club goods are excludable but non-rival in consumption. For example, cable television or streaming platforms can exclude people from consumption in the form of a subscription fee, but do not suffer if the number of users increases. Outside the realm of digital goods, the distinction between private and club goods is more difficult to make. For example, membership in a fitness club and use of the associated facilities is only non-rival until January, when all users want to pursue their New Year’s resolutions and all equipment is fully utilized.
Common goods are non-excludable but rival in consumption. These often include natural resources such as fish stocks or the availability of water for irrigating fields. Coordination between the various users is essential to prevent overuse of these goods.
Public goods are neither excludable nor rival in consumption. Such goods are hardly tradable on markets due to their non-excludability. The use of public goods without paying for them is described as the free rider problem. However, such necessary goods can still be provided through government funding.
However, the classification of these goods is not a natural one. Excludability in particular is not an inherent characteristic of a good, but depends primarily on technical possibilities, social negotiation, and social power relations. When dealing with natural resources in particular, the question of exclusivity is primarily a social and/or technical one. Water resources, for example, can be made technically accessible without any problems, but they can also be made exclusive. Even sunlight could theoretically be made exclusive, as Mr. Burns plans to do in the TV series “The Simpsons.” From his point of view, the sun is the enemy.
When categorizing goods, it is also important to note that this involves a process of reification. Goods are reduced to their purely economic value. This can be very problematic, especially for resources that are managed as common goods (also known as commons). It often obscures how commons structure social relationships and communities, enable participation, and maintain a relationship with nature and the environment. Ugo Mattei therefore argues that it is simplistic to say that we “have” a common good. Rather, it is a question of exploring the extent to which we “are” commons, insofar as we are also part of the environment (Mattei 2014, p. 76). For this reason, social anthropology, for example, often uses the verb “commoning” instead of the noun “commons.”
The tragedy of the commons
Actors cannot be excluded from consuming public and common goods. This can result in overuse of these goods, which was described by Garret Hardin in 1968 as the tragedy of the commons. Privatization of these goods (known as enclosure) is often proposed as a solution; whereby clear property rights can be assigned to exclude actors from use.
Elinor Ostrom researched the same topic and observed how self-organized cooperation within clear boundaries can counteract overuse even without the allocation of property rights. However, effective solutions to the overuse of non-excludable goods are highly context-dependent and therefore difficult to generalize. Ostrom was awarded the Alfred Nobel Memorial Prize in Economic Sciences in 2009 for her research on the commons. The now extensive research on the commons includes many examples of commons that have not been overused and have not succumbed to tragedy. There are examples of commons that have been managed collectively and sustainably for centuries (see, for example, De Moor (2015); De Keyzer (2018)).
The commons research conducted by Ostrom and others shows that there are solutions beyond privatization and nationalization to prevent the tragedy of the commons. This also fundamentally breaks down the dichotomy between the market and the state and enables points of contact beyond these two spheres.
3.7.2 External effects
The price paid for the use of goods does not always correspond to their true social cost. If the good is used at such a price anyway, the costs are passed on to third parties, i.e., neither to producers nor consumers, but to taxpayers, future generations, or nature, for example. When this happens, we speak of external effects. External effects can have a positive or negative impact on the production or consumption possibilities of third parties. In neoclassical economics, external costs are generally understood as an exception to an otherwise well-functioning market. In contrast, William Kapp pointed out as early as 1950 that the more a system is based on maximizing private profit, the greater the incentives to pass on costs to people, society, and nature (Kapp (1950)). Accordingly, the current capitalist system has inherent tendencies toward the externalization of costs. Anna Saave recently theorized this further (Saave (2022)). Stephan Lessenich describes affluent societies in the Global North as externalization societies that shift costs to the Global South (Lessenich (2020)).
Effect on… …production possibilities of third parties |
Effect on… …consumption possibilities of third parties |
|
|---|---|---|
| positive effect | Apple growers and beekeepers benefit mutually from pollination and apple blossoms. | Parents have their children vaccinated -> society benefits from lower infection rates and healthcare costs |
| negative effect | Industry emits pollutants into waterways -> third parties can no longer fish | Industry emits pollutants into water -> third parties can no longer swim in the river |
3.8 Costs
3.8.1 Cost types
If a company wants to provide a service, it has to pay its employees a wage. If a student goes out for a beer with friends after class, she cannot review the material she learned instead. And if farmers use too much fertilizer on their fields, the quality of the surrounding water will decline. Although different in different ways, in all of these scenarios costs occur. Costs are negative consequences that arise when creating value.
Production costs arise in the production of goods and services in companies when production factors are consumed for their creation. A distinction is often made between constant capital (machinery, tools) and variable capital (labor).
Marginal costs describe the increase in costs caused by an additional unit produced. As described above, this parameter is used in combination with marginal revenue to assess the quantity to be produced.
Opportunity costs are the costs of a lost utility that could have been obtained instead of the chosen use of the production factor or good. In the example above, the student decided to invest her time in social contacts instead of repeating the material. In this case, the opportunity costs is the utility that was not gained by repeating the material during this time. Since people always have different options for using their time, costs always arise according to the concept of opportunity costs. The famous saying “there is no such thing as a free lunch” means exactly that.
Transaction costs are the costs incurred in the process of transactions. For example, when purchasing a piece of land, a buyer pays a notary for certification and other costs, such as a land registry entry, in addition to the price of the land.
External costs arise when costs are not passed on to those who cause them (producers/consumers) but to third parties (society). Because these costs are not included in the true price of goods, they create incentives to consume the goods concerned in excessive quantities. External costs often take the form of environmental damage, as the value of nature is difficult to quantify.
3.8.2 Cost-benefit analysis
Cost-benefit analysis makes it possible to weigh up the costs and benefits. This tool allows the expected consequences of decisions to be assessed by weighing up the associated costs and benefits. The important prerequisite for this analysis is the monetary valuation of all consequences. Only in this way can an assessment be made using comparable variables. The establishment of cost-benefit analysis dates back to the discussion of social costs (external costs) in the 1950s and 1960s. Based on the work of economists such as William Kapp (1950), it was argued that the resulting social costs should be prevented through regulation. Ronald Coase (1960), on the other hand, argued that regulations also represent costs for companies – opportunity costs due to lost profits. For example, the profit of a chemical company that pollutes a river through its activities. This profit must be offset against the social costs. According to Coase, such a total calculation provides a basis for arguing against regulation and for the expansion of property rights (i.e., the market).
The cost-benefit analysis has several problems. One difficulty is that the value of many areas of social and natural life cannot be clearly quantified with a price. For example, it is not possible to put a clear and objective price on an endangered animal or plant species, the existence of a forest, clean air, or a human life.
To meet this challenge, researchers have developed various methods to enable the quantification of monetary values. Two essential methods are important here:
Using stated preference methods, actors can be asked about various future scenarios. Previously unknown circumstances can thus be weighed against each other.
In revealed preference methods, a utility assessment for the future is derived from decisions that have already been made. This prevents actors from giving strategic answers when assessing expected future scenarios. However, conditions that have not previously occurred cannot be assessed.
Although there are established methods for assessing preferences, these are limited in their ability to weigh up costs and benefits. As the term “preference” already suggests that these are always subjective views. The monetary assessment derived from them will therefore always be subjective, i.e., not an objective figure.
Example: At the beginning of this millennium, it emerged that the tobacco company Philip Morris had commissioned a cost-benefit analysis of the effects of smoking on the Czech Republic. The authors concluded that smoking generated an annual profit of around 5.8 billion koruna (approx. USD 150 million) for the Czech state budget. Due to the lower life expectancy of smokers, the state had to provide for them for a shorter period of time and therefore saved money.
This report sparked a public outcry, prompting the tobacco company to apologize. But this example also highlights the subjective nature of cost-benefit analysis. By reducing the value of human life to a number, the company had not only crossed a moral line. As a scientist later showed, the company had also made false assumptions and omitted far-reaching costs in the report. Her cost-benefit analysis of the same scenario concluded that smoking in the Czech Republic contributed to an annual deficit of around 14 billion koruna.
Another problem is that a cost-benefit analysis implies that different types of capital are substitutable, i.e., that the loss of biodiversity can be replaced by technology. This assumption is controversial and is one of the central points of contention between different understandings of sustainability. We will return to this in section 6 in the discussion of strong and weak sustainability.
3.8.3 Discounting – the factor of time
The factor of time is included in the cost-benefit analysis by means of discounting. Costs incurred in the future are valued at a lower level. The discount rate influences how much perceived costs decrease over time. Various decision-making criteria can be used to determine the discount rate. Intergenerational justice, the choice between strong and weak sustainability (introduced in section 6), uncertainty about future events, and the time preference of decision-makers influence how much future costs are discounted.
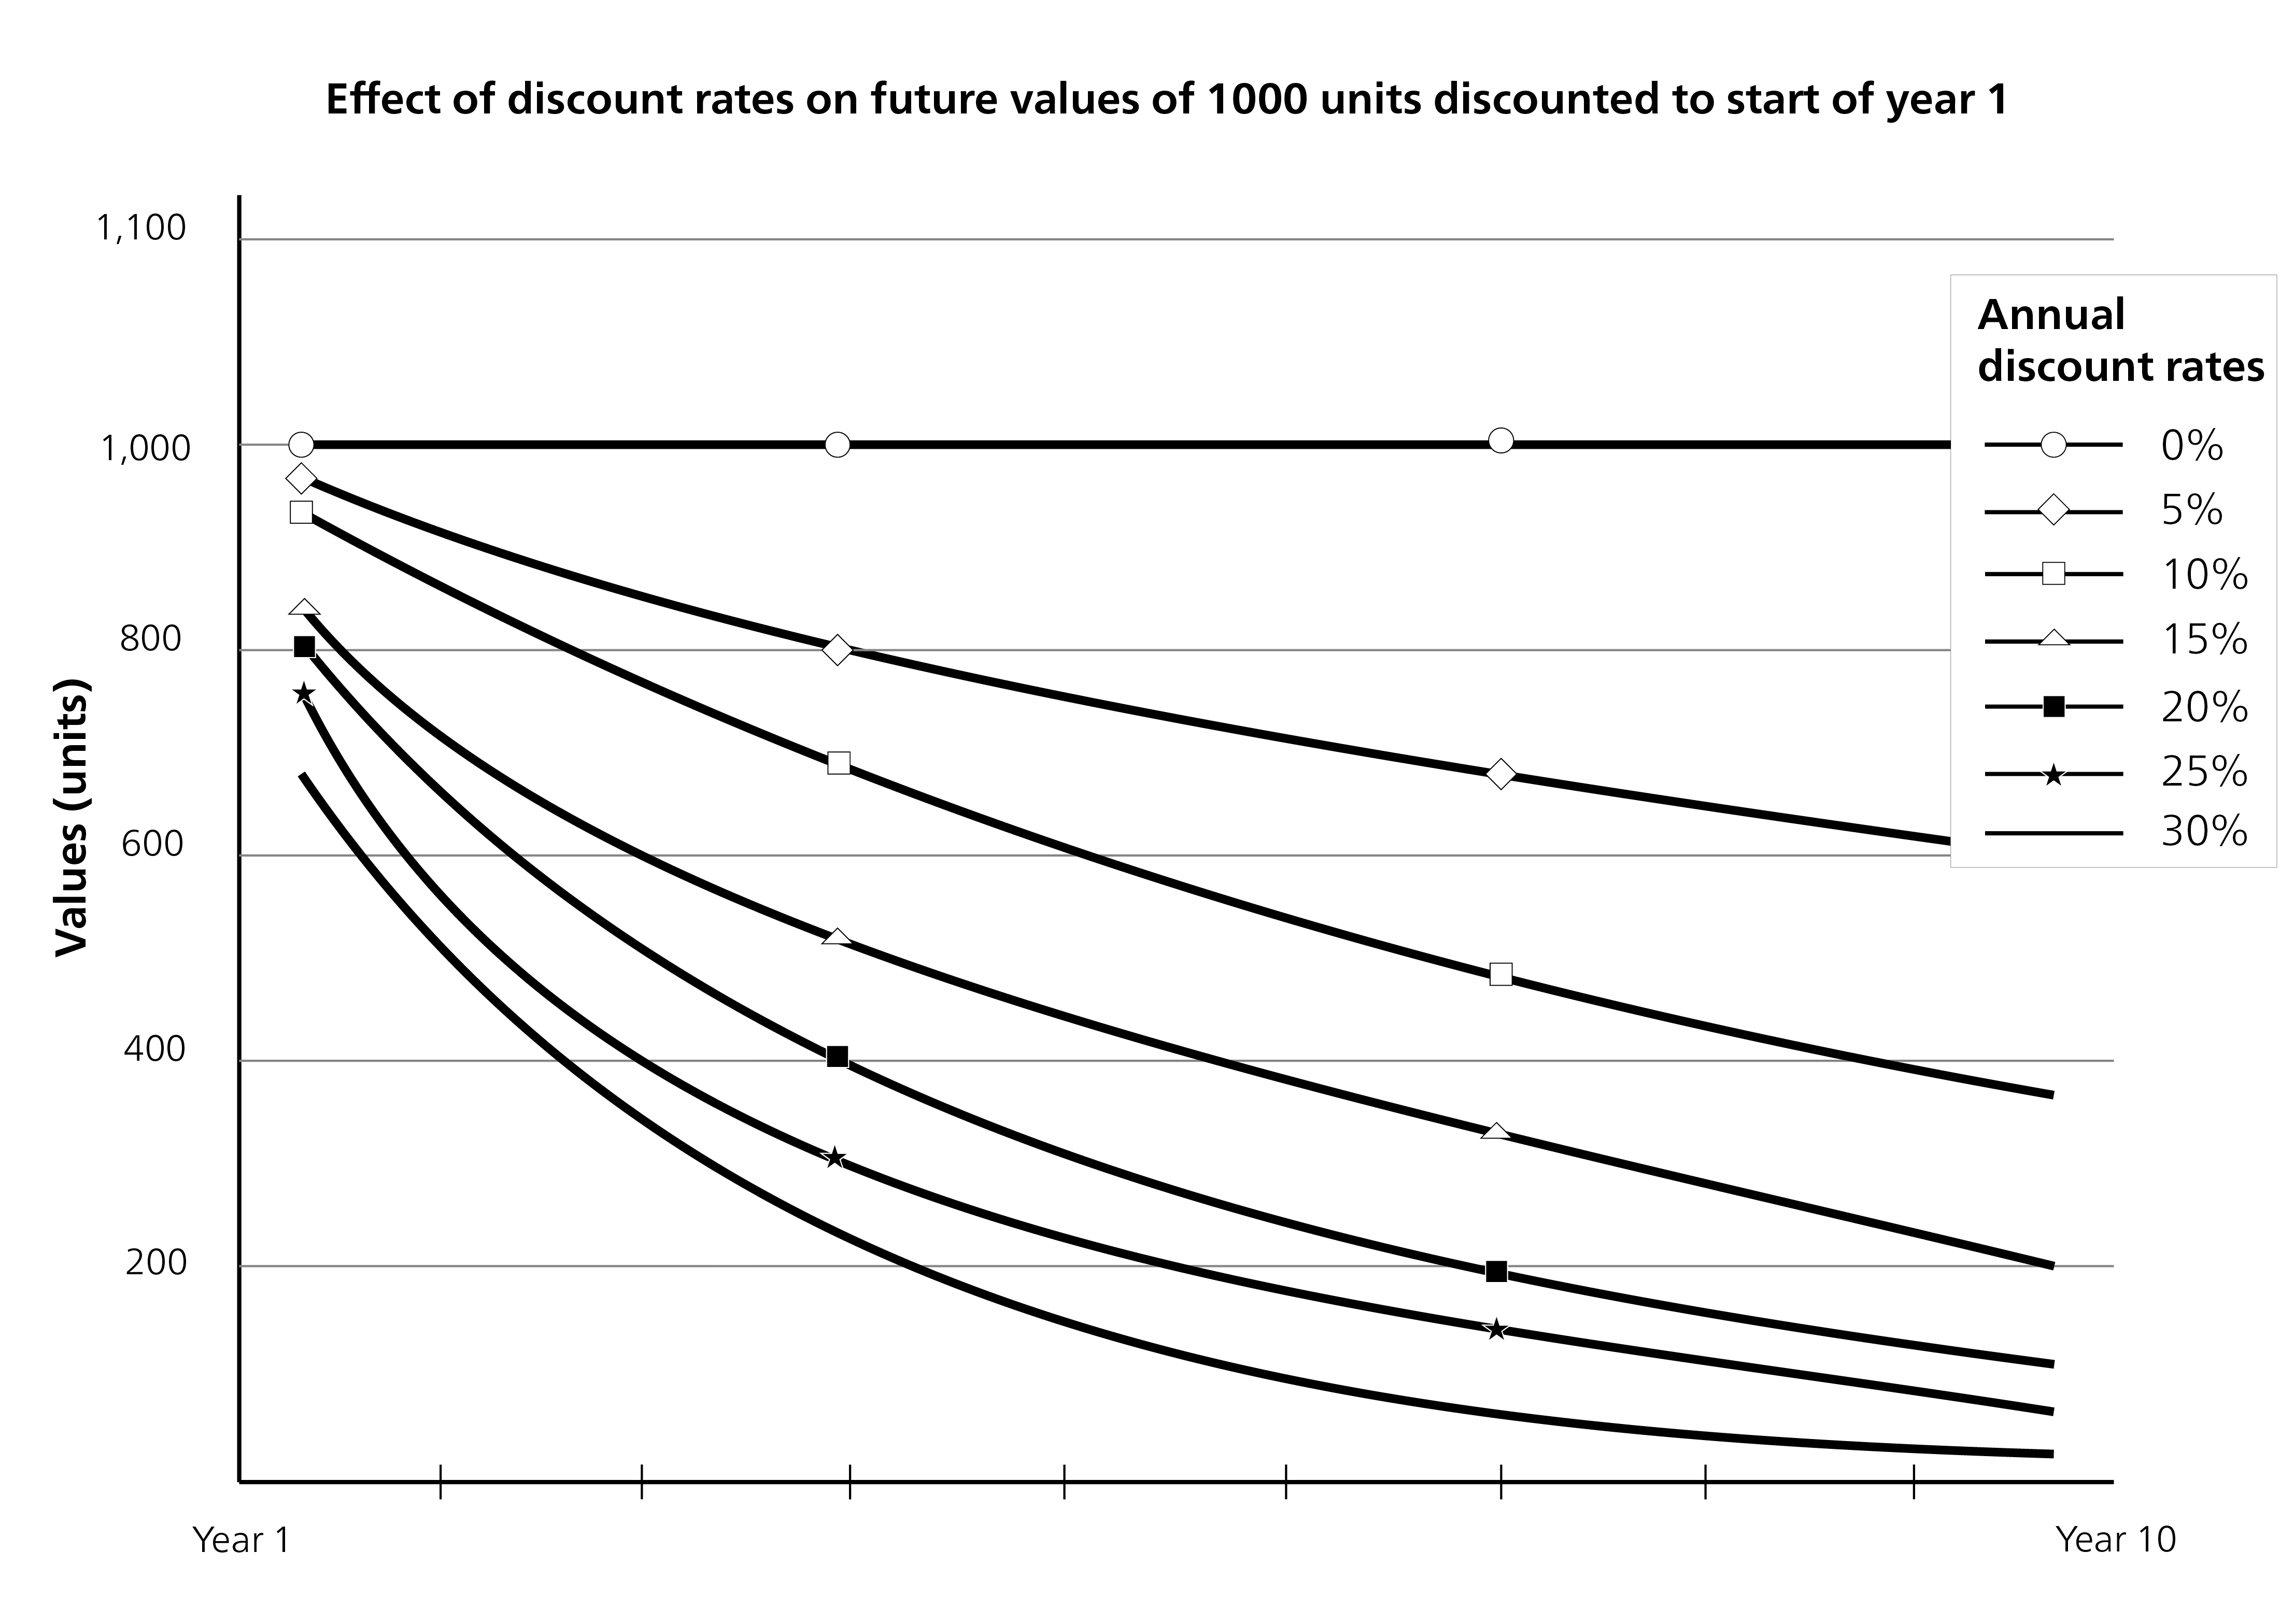
The figure above shows different discount rates over the same period. For example, the cost of climate damage of $1,000 occurring in 10 years is valued at approximately $860 at a discount rate of 1.5%. At a discount rate of 5%, only around $600 is included in the cost-benefit analysis as perceived costs. 10% discount rate value the $1,000 in 10 years at around $350 in the present.
Example: In 2006, British economist Nicholas Stern published the Stern Report for the British government. In this comprehensive document, he describes climate change as the greatest market failure in history and uses cost-benefit analysis to argue that one percent (he later argued for two percent) of global GDP must be invested in reducing emissions.
Economists had mixed reactions to Stern’s report. While some supported him, others argued that he had miscalculated the costs of global warming. The main argument was his low discount rate of 0.1 percent, which he used to assess future costs. Economist William Nordhaus took Stern’s calculations and changed only the discount rate from 0.1% to 3%. According to this, investments to combat global warming are still necessary, but much lower than Stern demanded. In the logic of the cost/benefit analysis, Nordhaus concludes that, in the best-case scenario, global warming will rise to over 3 degrees by 2100 (Nordhaus (2019)).
The question of the discount rate represents a clear ethical position in this example. Stern chose a discount rate of 0.1%, assuming that the annual risk of human extinction is 0.1%. Otherwise, the welfare of future generations should be weighted exactly the same as today’s. Nordhaus’ discount rate, on the other hand, weights the welfare of future generations by 3% less each year. This is based on the assumption that the economy will continue to grow at this rate and that the costs will therefore be perceived as lower.
The calculation of future costs and benefits therefore depends on many assumptions and ethical questions. These are supposed to be reflected numerically in the discount rate.
3.9 Prosperity in a Changing World
In our modern world, characterized by rapid change and a constantly growing population, the term “prosperity” is often associated with economic and monetary wealth. However, in times when environmental change, social inequality, and resource scarcity are becoming pressing challenges, this conventional view of prosperity is no longer sufficient. The complexity and multifaceted nature of the concept make it controversial. In addition, measuring prosperity is extremely difficult and therefore leads to controversial discussions. There are many different indices that attempt to measure a country’s prosperity. The most widely used is gross domestic product (GDP). It is omnipresent in everyday life, politics, and the media and appears to be the most important economic indicator. GDP is criticized primarily for its narrow focus on wealth in terms of goods and services sold on the market, and also because the indicator does not provide a comprehensive picture.
3.9.1 Gross domestic product (GDP) as an indicator of prosperity
GDP is considered the main indicator of a nation’s prosperity. It measures the total value of all goods and services produced in a country in a year after deducting all intermediate inputs. The concept of GDP in its current form was first developed in the 1930s – the first attempts to measure a country’s prosperity date back to the work of William Petty in the 17th century – to combat the Great Depression and plan the war economy during World War II in the US and England (Schmelzer and Vetter (2023), pp. 57-59). A prerequisite for this was the invention of the “economy” as an independent sphere of social life that can be statistically recorded and measured (Schmelzer and Vetter (2023), p. 57). Despite its widespread use today, GDP is still subject to criticism. Even economists who promoted the development of GDP warned against using it as a general measure of prosperity. Simon Kuznets, one of the most prominent economists in this field, said:
“Whatever one may do with them, such numbers […] appear to be highly useful; they appear to meas-ure something clearly defined and significant, making it comparable. But upon closer inspection, the impression that such estimates are clear and unambiguous proves misleading.”
(nach Lepenies 2013: S. 90), own translation)
The main criticism is that GDP only measures the monetary value of goods and services that have been purchased with money. The entire unpaid sector of the economy, such as unpaid care work or undeclared work, is not taken into account. GDP also says little about the actual well-being of a population, as it is reduced to purely material possessions. Furthermore, GDP neglects the social and environmental impacts of economic activities, such as social inequality and environmental pollution. Damage to the environment can even have a positive effect on GDP if, for example, after a natural disaster reconstruction has to be finance, leading to an increase in GDP. Personal accidents also increase GDP due to medical treatment, even though they represent a significant deterioration in the well-being of the person concerned. Furthermore, income distribution is not taken into account, which means that a high GDP does not necessarily reflect a fair distribution of income. In addition to these major well-known criticisms, there are several others that we will not go into further here. Finally, GDP is based on annual growth rates, which can lead to short-term thinking, with policymakers and companies pursuing short-term goals to increase GDP rather than striving for long-term sustainability goals.
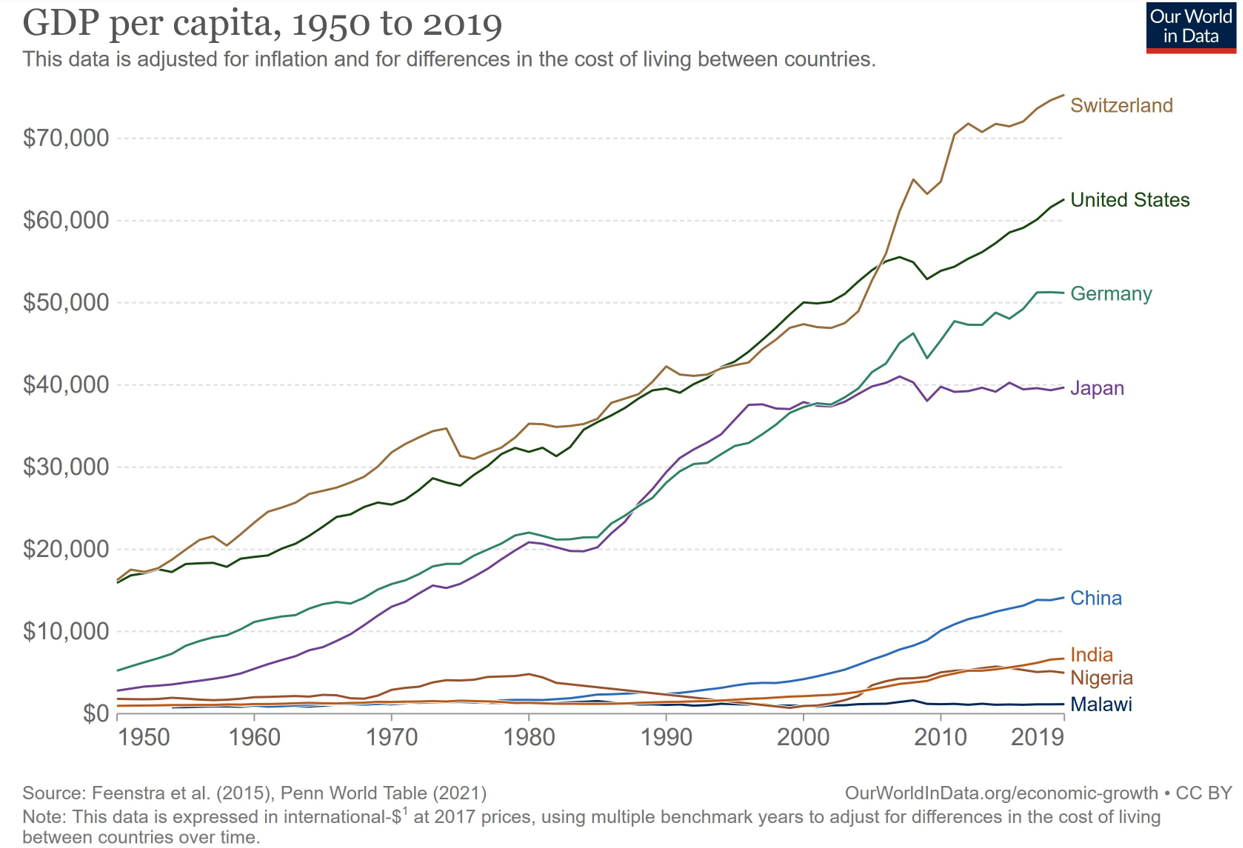
The following chart shows the development of Switzerland’s GDP compared with selected other countries over the last 70 years.
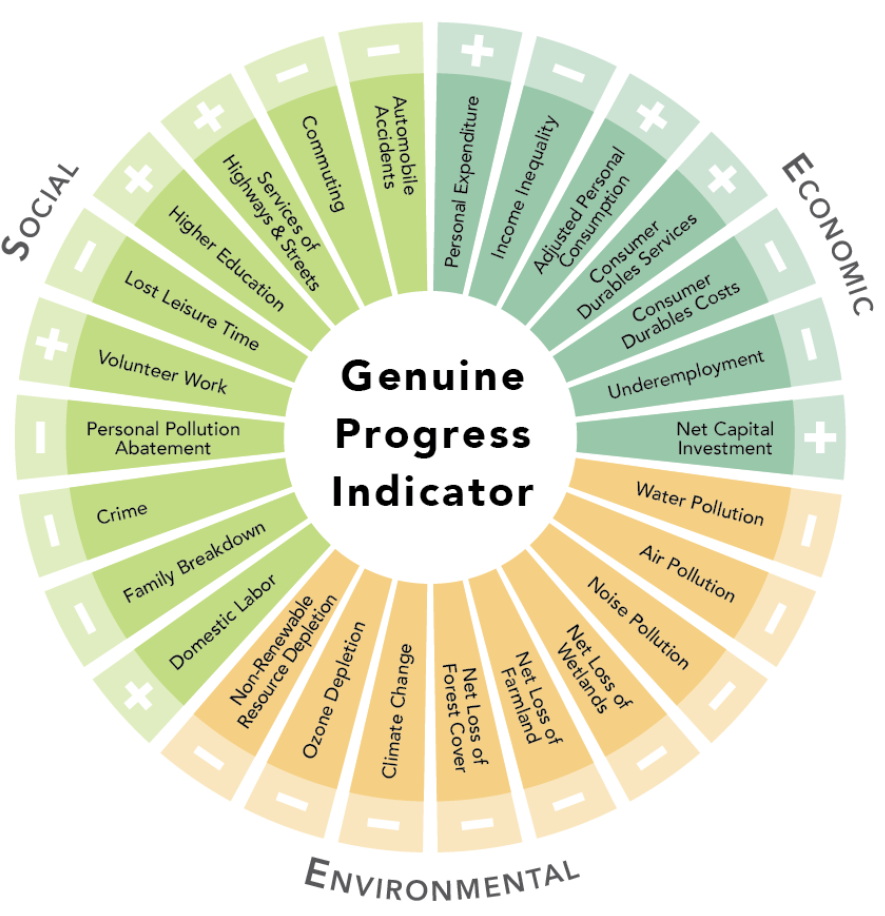
3.9.2 Alternative indicators of prosperity
In view of these limitations of GDP, several alternative indicators have been developed to provide a more comprehensive picture of prosperity. One of these indicators is the Human Development Index (HDI), which takes into account not only GDP but also life expectancy and the level of education of the population. Another indicator is the Genuine Progress Indicator (GPI). The GPI goes one step further by attempting to include not only positive economic activities but also negative factors such as environmental pollution and social inequality in its calculations. The GPI usually consists of 26 indicators that attempt to cover the economic, social, and ecological dimensions. For example, the value of unpaid work is also included. Since it is fundamentally difficult or even impossible to measure prosperity, these indicators are also criticized for their limitations, and there are many other indicators for measuring a country’s prosperity. However, none of them have been able to establish themselves alongside GDP.
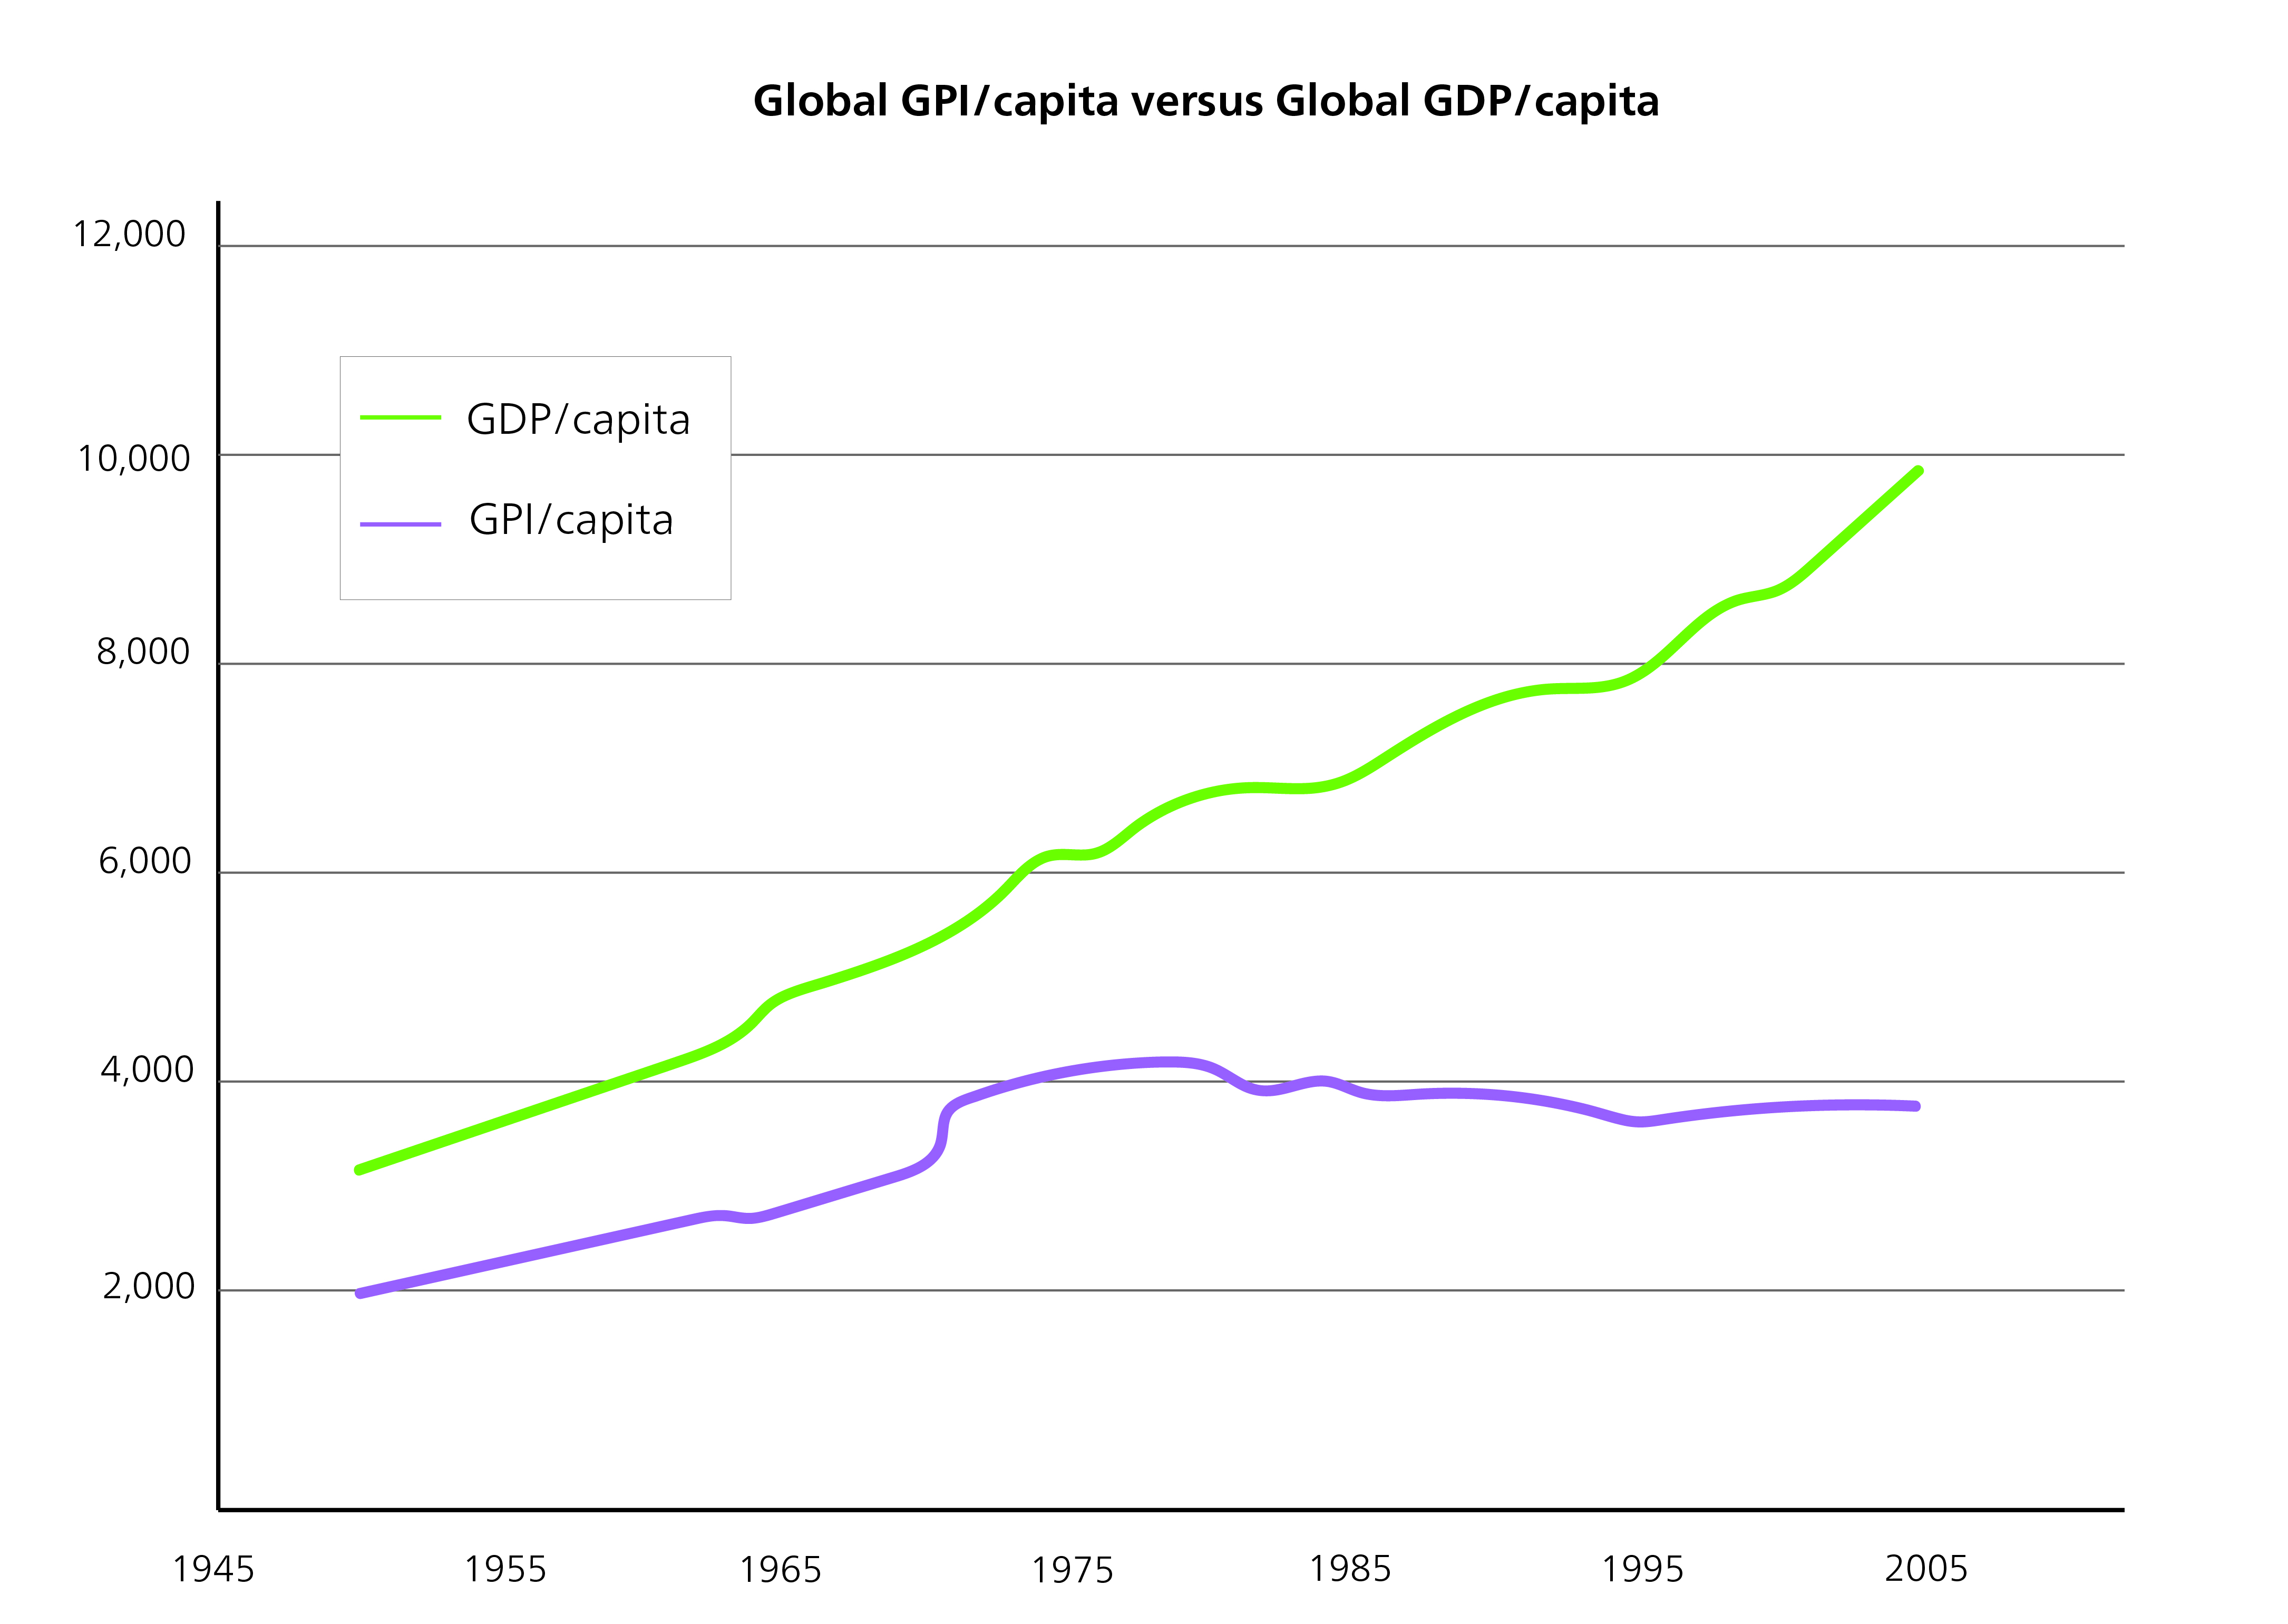
To illustrate how widely different indicators can diverge, the calculations by Kubiszewski et al. (2013) for the development of GDP and GPI per capita since the 1950s for a group of 17 countries are shown here.
3.9.3 Economic growth
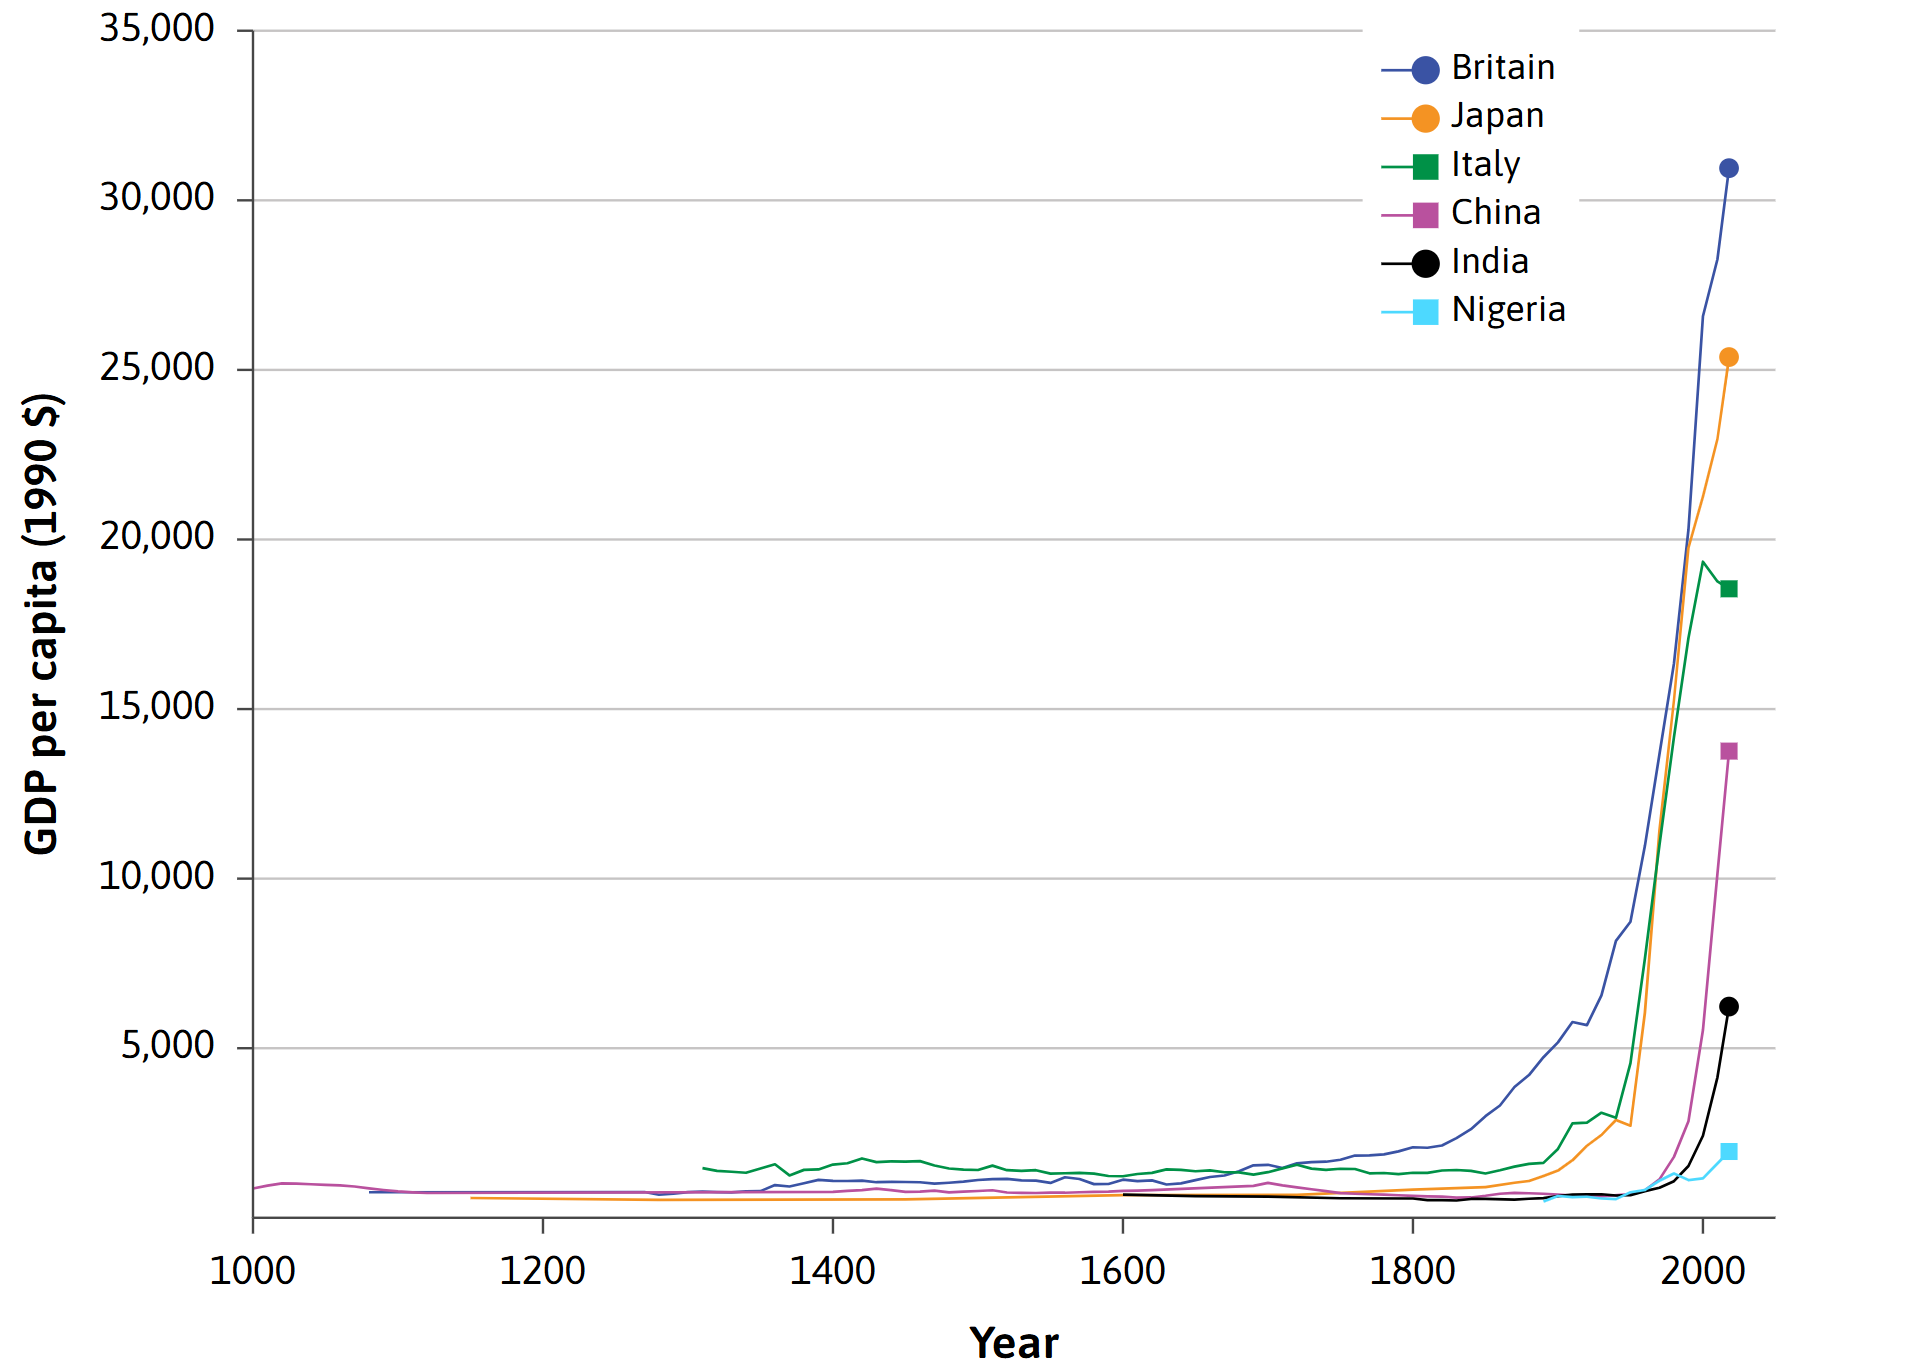
Economic growth basically refers to the increase in a country’s economic performance or prosperity over time. As a rule, GDP growth is used as a measure of this. The central importance of economic growth for our society and economy is omnipresent in everyday life, politics, and the media. It is the central target for politics, society, and the economy, which is why Schmelzer and Vetter also refer to it as the growth paradigm (Schmelzer and Vetter (2023), pp. 62–68). Given the ubiquity of economic growth, it is surprising that it is a very recent phenomenon. It was not until the Industrial Revolution in England in the 19th century that sustained economic growth (measured in terms of GDP) was observed for the first time in the world. For most of human history, people lived without sustained economic growth. Today, economic growth is not only a central pillar of our current economic and social system, but has also become a compulsion (Binswanger (2019)). We will discuss this systemic compulsion to grow and the growth paradigm in more detail later in the course. The significance of economic growth is the subject of intense debate within the sustainable economy, with widely divergent positions. While some want to hold on to economic growth (in an adapted form), others advocate overcoming economic growth as a compulsive behavior. We will examine these discussions in greater depth at a later stage.
The following chart shows the development of GDP per capita for various countries and regions over the last 1,000 years. The industrial revolution in the 19th century is clearly visible.